Measuring and Reducing Time Spent on Ad-Hoc Data Requests
Teams can measure and eliminate the hidden costs of ad-hoc data requests.

Ad-hoc data requests are a measurable tax on engineering and data teams. Reducing that tax means counting the hours, delays, and planned work it consumes, then changing how non-technical teams get answers. Governed self-serve access is the structural fix, and measurement is how a team knows whether it has actually worked.
Why ad-hoc data requests are a structural tax, not a staffing problem
A data engineer plans to spend the morning building a pipeline, then spends it debugging a broken dashboard and explaining wrong numbers to a VP. The pipeline waits, but the morning still looks like time well spent because urgent problems got attention. This can happen even when the engineer works fast and the executive asks no more than usual. It only requires a system in which business questions and data repairs must pass through the same people who build the infrastructure. The queue becomes the team's real manager.
Centralizing queries and pipeline work can keep governance consistent, but it also makes every new question another claim on scarce engineering time. Hiring can ease that pressure while leaving the system that causes it in place. More people can answer tickets, yet business users still need someone else to retrieve and explain their data. Giving analysts unrestricted access is not a clean escape either, because it trades the bottleneck for governance and data quality risks. The choice is not simply between more gatekeepers and no gates, but between access that depends on individual help and access designed to work without it.
How much time ad-hoc requests actually consume, and why teams have stopped noticing
The 2026 State of Data Engineering Survey found that data engineers spend roughly a third of their time on data quality and reliability work and roughly a quarter on firefighting. Together, that is more than half the working week spent reacting. Those categories are broader than ad-hoc queries, so the finding is not a ready-made estimate of any particular team's request load. It does, however, show how much capacity reactive work can absorb. A team trying to understand its own tax needs to separate the requests from the surrounding repair work.
The more revealing finding is how respondents described their constraints. Only a small fraction cited data quality as their biggest bottleneck, ranking legacy systems, lack of leadership direction, and poor requirements higher. Reactive work can occupy much of the week without being recognized as the thing consuming it. Once firefighting becomes the default job description, it stops looking like an interruption. The fire alarm is now the office music.
That normalization also hides why apparently small requests take so long. A two-minute SQL answer can take days to arrive because the query sits in a queue, needs clarification, and competes with other interruptions. Counting only the time spent writing the query leaves out both the time the requester waits and the team's constant context-switching. If those costs remain folded into “the job,” there is no baseline against which a better arrangement can be judged.
The metrics that make ad-hoc request volume visible and comparable over time
Start by measuring time consumed, time spent waiting, and work displaced. These are not three ways of counting the same inconvenience. Analyst hours describe the capacity used, while request-to-delivery time describes the service the business receives. Deferred work shows what that service prevents the team from building.
For time consumed, track how many hours analysts spend each week on ad-hoc queries against the hours they spend on planned work. Even a rough Jira or Linear category split gives the team a baseline. A rough measure makes the cost discussable and gives later claims of reclaimed capacity a measurable basis.
For the queue, track how many requests are waiting and log request-to-delivery time per ticket. The gap between asking and receiving an answer is the clearest sign of the access bottleneck. For opportunity cost, keep track of the strategic or planned work deferred while routine requests get handled. If three platform initiatives sit untouched, that deferral list describes the cost more clearly than a busy ticket board. Completed requests are output, but they are not the whole account of what the team accomplished.
Once self-serve access is in place, adoption adds a forward-looking measure. Track the fraction of the organization actively using it. For a mid-size company, a practical test is to define a small set of shared KPIs, make their logic queryable without SQL, and see whether request volume falls meaningfully within a few months. The value lies in the change from the baseline. Instrumentation should help expose the queue.
Why ad-hoc data modeling doubles the firefighting burden
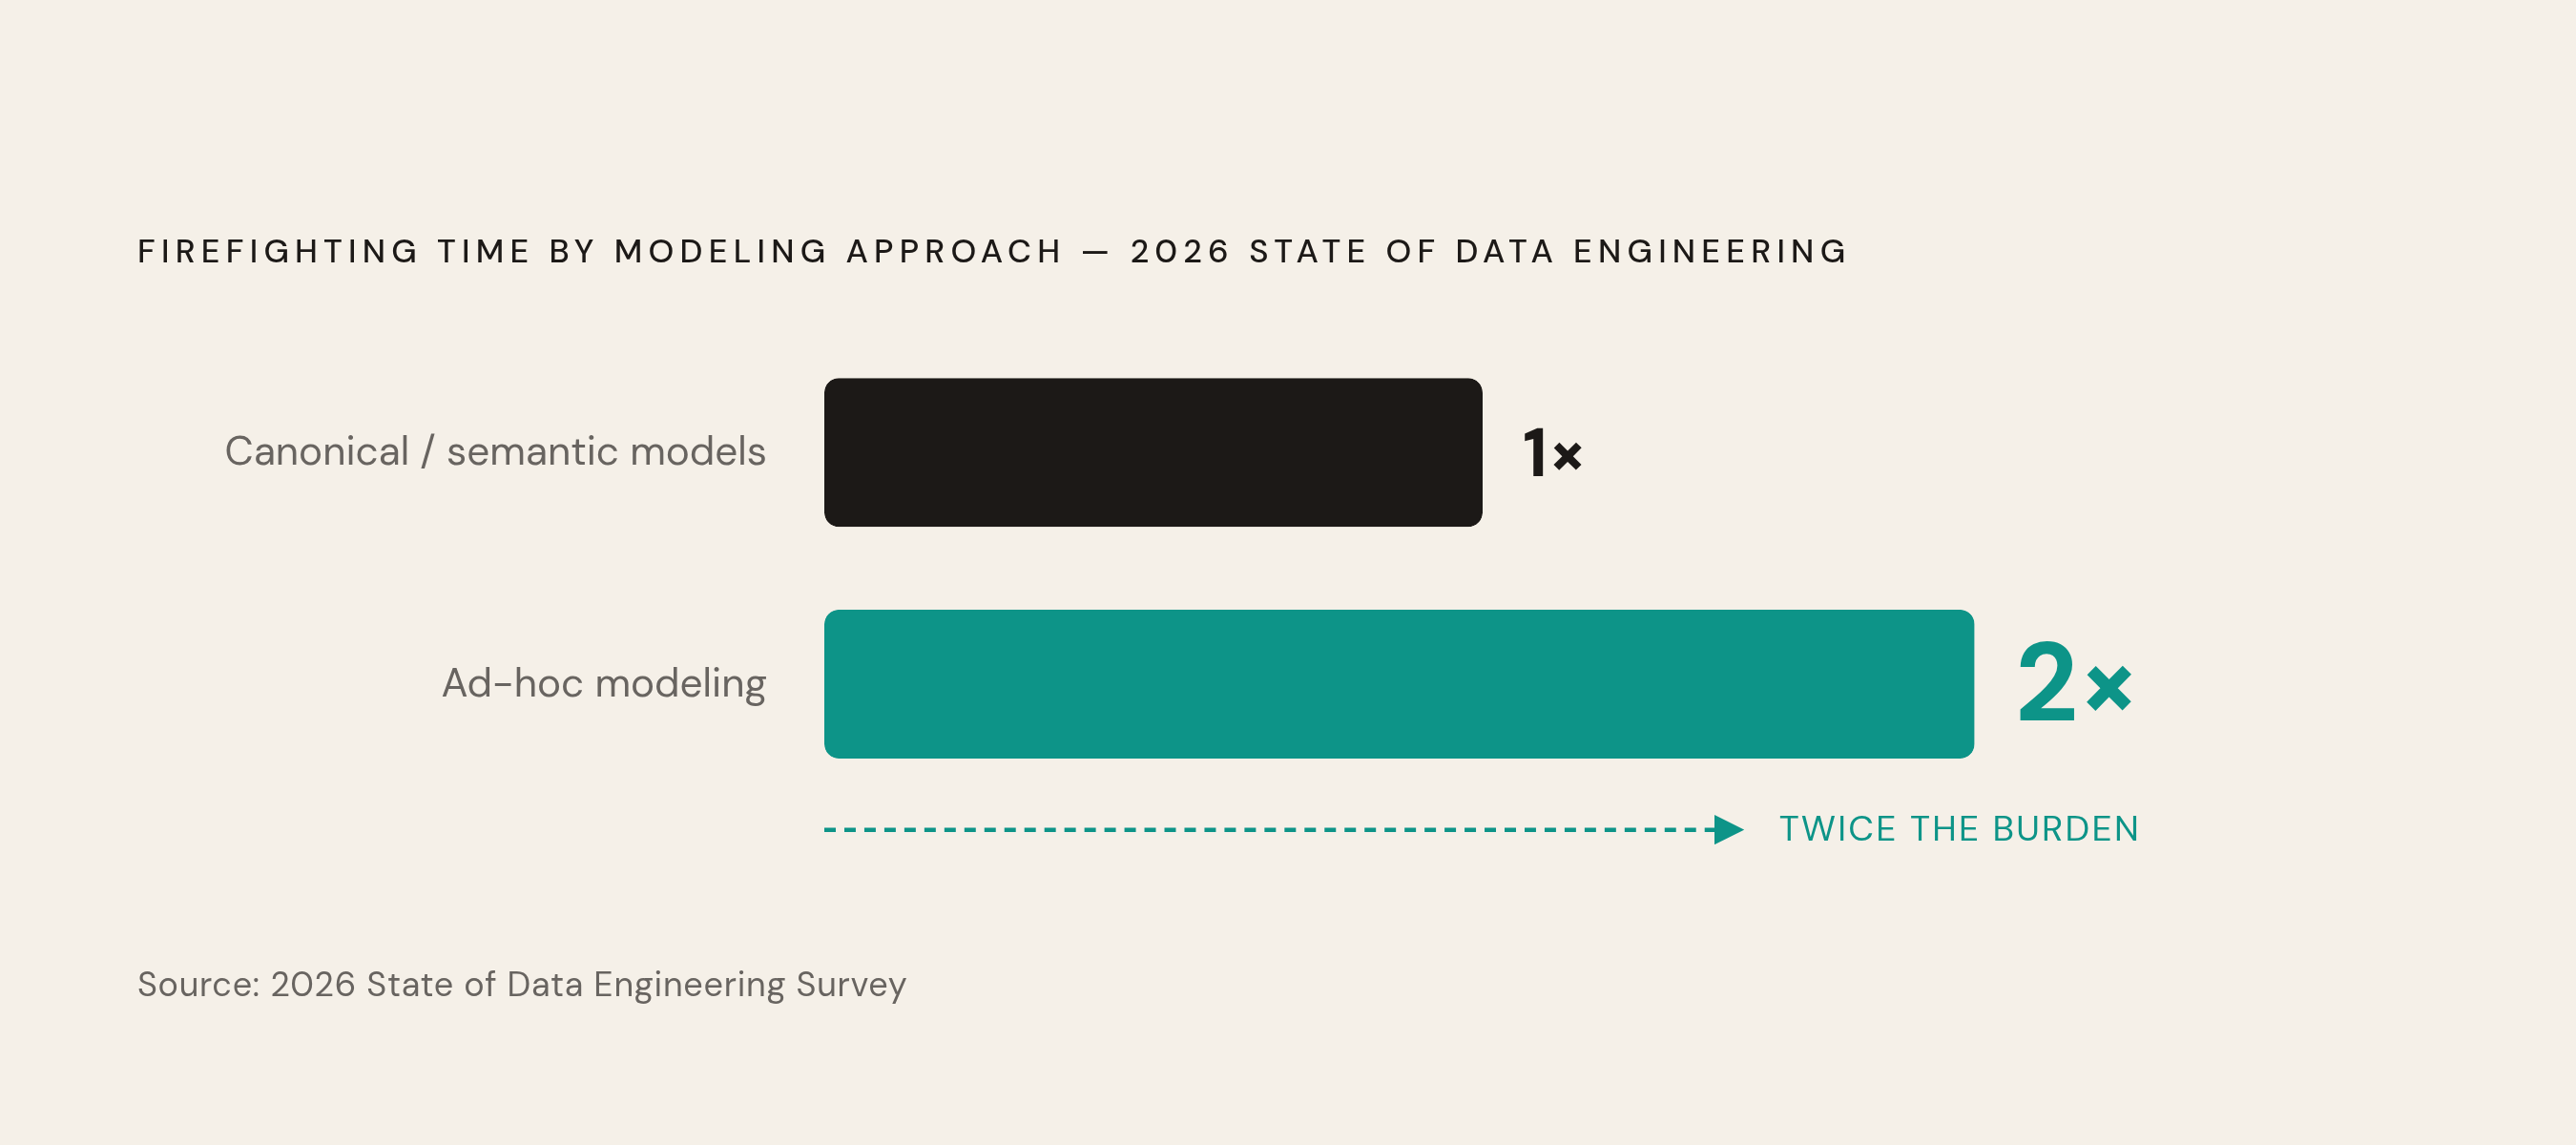
The 2026 State of Data Engineering Survey found a correlation in which teams using ad-hoc data modeling spend roughly twice as much time firefighting as teams with canonical or semantic models. The way a team organizes its data is tied to the amount of time it spends repairing and explaining it. Counting tickets without looking at the models behind them leaves much of the problem out of view.
More than half of survey respondents named “pressure to move fast” as their top modeling pain point. Hurried, ad-hoc modeling decisions create inconsistencies, which generate fires, which consume the time needed to model properly. The objection that there is no time to build a shared model is therefore part of the trap. Borrowing time from modeling can leave the team paying it back in firefighting.
Making analysts get VP approval for every new data connection can push them to export spreadsheets and email files. Governance then creates the very data sprawl it was meant to prevent. The modeling decision is not whether to favor speed or control at all costs, but how to give people reusable, governed data they can actually reach. A shared model can break the firefighting loop only when people can get to the data they are allowed to use.
Shifting non-technical teams to self-serve data access rather than absorbing their requests
Make most routine requests unnecessary. Faster service still requires a responder each time someone has a question. Governed self-serve access removes that dependency by letting non-technical teams find answers themselves.
The word “governed” does essential work here. When business users have raw database access or unmodeled tables, different teams can get different numbers from the same data. When those numbers disagree, trust collapses and requests return to the data team for reconciliation. A shorter route to a disputed answer is not much of an improvement. Ungoverned self-serve can turn one queue for answers into another queue for deciding whose answer is right.
A semantic layer or shared data model sits between the raw database and the business user. It gives people the same definitions and uses row-level permissions, while a plain-language or visual interface lets them query without writing SQL. People need both common definitions they can get to and a tool they can use.
The organizational shift follows from that design. Engineers move from building individual pipelines on request to building and maintaining the governed platform that analysts and business users build from. Instead of fifteen people maintaining fifteen slightly different customer lists in spreadsheets, they query the same governed customer table. Accuracy improves with speed because the answer no longer depends on which copy someone happened to open.
Access also has an economic boundary. Per-seat pricing in traditional BI tools can put a ceiling on how many people across the organization use self-serve. When pricing models have no per-user cost, that cost no longer stands in the way of rollout. A self-serve system cannot reduce the queue for people kept outside it.
What a database-native tool provides that a separate BI stack does not
For a company without a mature BI stack, the lightest path to governed self-serve can be a tool that connects directly to the production database. Traditional BI stacks require a separate pipeline from the database into the BI tool. That adds another engineering surface to build and maintain when maintenance is already consuming the team's time. A database-native tool skips that separate ETL step. The distinction is where the access layer sits and how much infrastructure must exist before business users can use it.
A GUI connected directly to Postgres, MySQL, or another database can turn the existing source into dashboards, saved queries, and editable views. Non-technical users in product, sales, marketing, and support can query and edit records through a permissioned interface without SQL knowledge or engineering tickets. The database remains the source rather than the starting point for another data-moving pipeline. This makes direct access useful for a team trying to reduce both routine requests and the machinery required to serve them. It does not make the shared definitions discussed earlier optional.
With row-level permissions and governed views, teams can move past the choice between sharing raw credentials and asking for a ticket for every task. The former is insecure, while the latter preserves the delay that self-serve is supposed to remove. A database-native tool solves that access problem without a separate BI pipeline. Its value in this setting is that a company may not need to build a new stack to provide governed access to existing data.
Measuring whether the shift is working after you make it
After rollout, the same baseline must do a different job. It first showed the cost of the old arrangement, and now it tests whether that arrangement has changed. Compare data request volume before and after rollout, then repeat the time-allocation assessment. The difference in hours spent on ad-hoc queries versus planned work is the return expressed in capacity. A quieter queue matters most when the planned work it displaced can move again.
Track the fraction of the organization actively using self-serve. Low adoption usually means the tool is not accessible enough or the definitions are not trusted. Then spot-check how long a non-technical team member takes to get from question to answer. If that still takes days, the bottleneck persists in a new place.
For a mid-size company, a meaningful drop in ad-hoc request volume within three to six months is a realistic, measurable benchmark. If it does not materialize, the diagnostic question is whether inconsistent definitions are undermining answers or whether people are not using the tool. Those are different problems, and the measurements help distinguish them. The aim is a feedback loop of tracking, intervention, and tracking again, with data access treated as infrastructure to maintain. That loop is what separates a structural improvement from temporary relief.