Postgres Autovacuum Tuning for High-Write Tables
Defaults designed for average workloads leave high-write tables drowning in dead tuples.

Postgres doesn't delete rows when you update or delete them. It marks the old version dead and leaves it right there on the page. That's MVCC (multi-version concurrency control), and it's the whole reason autovacuum exists. Every UPDATE on a busy table leaves behind a dead tuple. Every DELETE does too. Nothing else cleans that up. Not the query planner, not a background cache flush, nothing. If autovacuum doesn't get to it, it just sits there.
On a quiet table, that's fine. Dead tuples trickle in slowly and vacuum keeps up without anyone noticing. On a high-write table, tens of thousands of updates an hour can leave hundreds of thousands of dead tuples behind within a single hour. That's not a slow leak. That's a flood.
And the consequences stack up fast:
- Table bloat. Disk usage grows even though you don't have any more real data.
- Index bloat. Index entries keep pointing at dead rows until vacuum cleans house.
- A confused query planner. A table with a million dead tuples looks, to the planner, like it has two million rows. Cost estimates inflate. The planner starts picking slower scan paths for no good reason.
- Eventually, total write refusal. That's transaction ID wraparound, and we'll get to it. It's the endgame of ignoring everything above.
Here's a real case, or close enough to one you've probably lived through: a fintech company had queries running a clean 50 milliseconds, then randomly spiking to 8 seconds. No slow query log entries. No lock contention. Nothing that normally points a finger. The answer was sitting in pg_stat_user_tables: 14 million dead tuples, and autovacuum hadn't touched the table in three days.
That's the thread this whole article pulls on. Autovacuum was running. It just wasn't running enough, and the defaults were the reason why.
What autovacuum's defaults were designed for, and where they break down
Postgres ships with autovacuum settings built for an average workload. Not a small workload, not a heavy one. Average. That's a reasonable design choice for a database that runs everywhere from a hobby project to a bank's core ledger. But it means those defaults are quietly wrong for a lot of production systems, especially ones with real write volume.
Take autovacuum_vacuum_scale_factor. Default is 0.2, meaning vacuum won't even consider a table until 20% of its rows are dead. Sounds modest until you do the math on a big table. On a 10 million row table, that's 2 million dead tuples sitting around before vacuum lifts a finger. That's not a safety margin. That's a backlog.
Then there's cost-delay throttling, which is arguably the sneakier problem. Postgres 12 bumped the default autovacuum_vacuum_cost_delay to 10 times the previous autovacuum default. The intent was caution: keep autovacuum from hammering the disk and starving real queries. Reasonable in theory. But on a high-write table, that throttle can slow autovacuum down so much it never catches up to the rate new dead tuples are created. The fintech case above? That was the entire cause. Just a conservative default fighting a workload it wasn't built for.
Here's what that looks like once it's had time to fester: a lab_results table holding 2 GB of actual live data was consuming 31 GB on disk, indexes included. Queries that used to return in 40 milliseconds were creeping past 3 seconds. That gap, 2 GB of real data versus 31 GB of disk footprint, is basically a receipt for how long neglect has been going on.
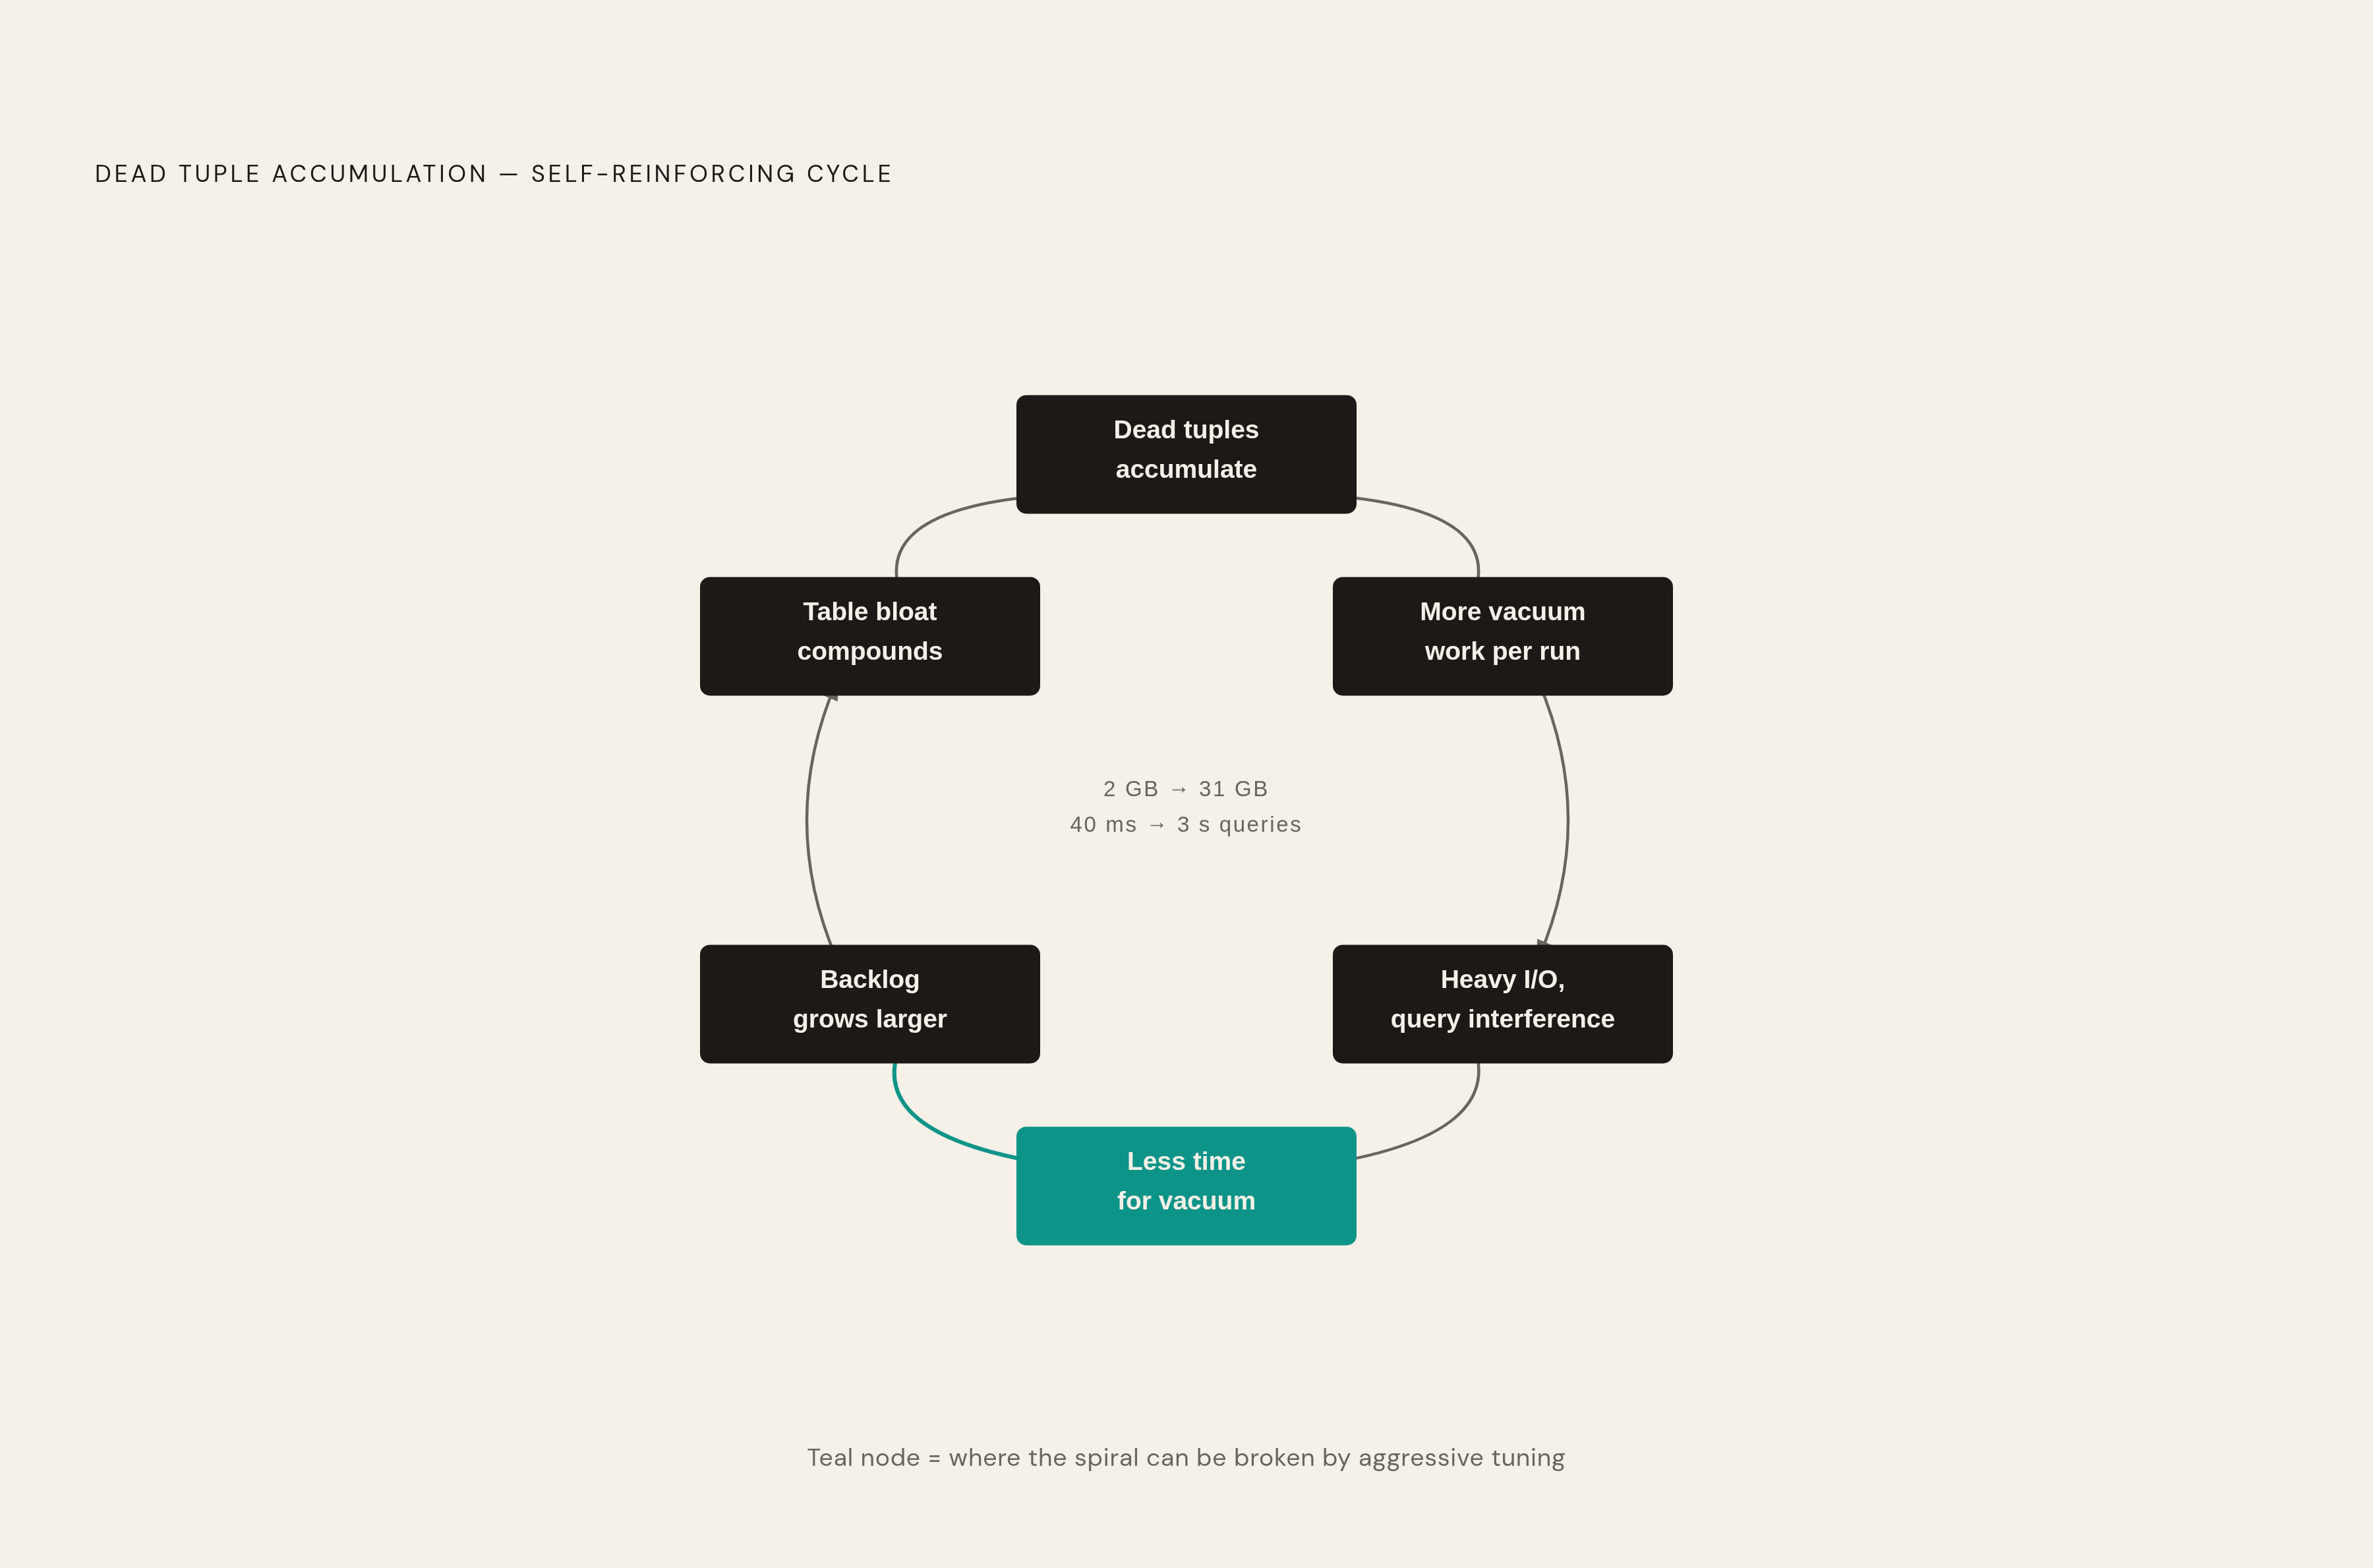
And it gets worse the longer it's ignored, because vacuum work doesn't stay flat. The more dead tuples pile up, the more work each vacuum run has to do, which means more I/O, which means more interference with live queries, which buys you even less vacuum time before the next backlog builds. It's a spiral, and it feeds itself.
So where do you actually look? pg_stat_user_tables. Specifically the n_dead_tup column (how many dead rows are sitting there right now) and last_autovacuum (when, if ever, vacuum last ran on this table). That's step one for basically every autovacuum problem you'll ever chase down.
The parameters that control when autovacuum wakes up for a table
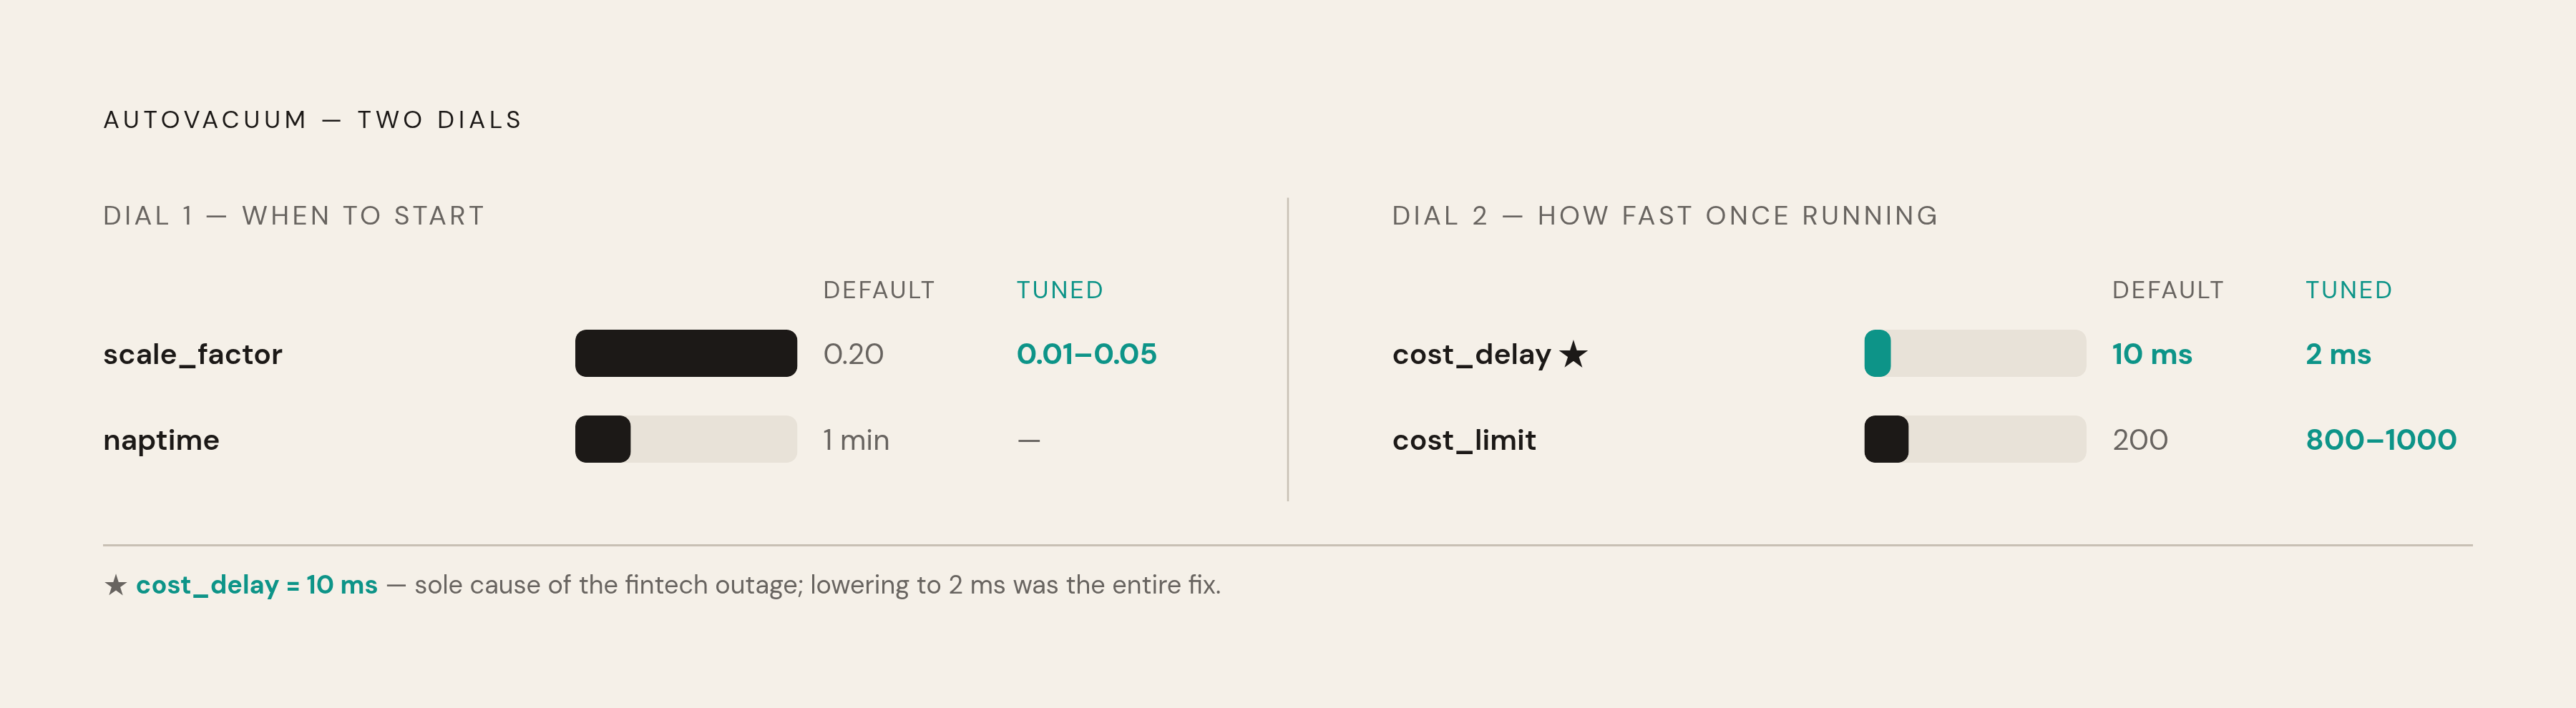
Think of autovacuum as running on two separate dials: one that decides when it bothers to look at a table, and another that decides how fast it works once it starts. Let's take the "when" dial first.
autovacuum_naptime — default is 1 minute. This is how often the autovacuum launcher wakes up, scans every table in the database, and fires off vacuum or analyze where thresholds are crossed. You can shrink this to make autovacuum more responsive, but it comes at the cost of more overhead from the launcher process itself checking in more often. This is rarely the lever you want to pull first.
autovacuum_vacuum_threshold and autovacuum_vacuum_scale_factor — these two work as a pair. Vacuum triggers once dead tuples exceed threshold + (scale_factor × live_row_count). The scale factor is the one that bites on large tables, as we already saw with that 0.2 default. For high-write systems, dropping the global scale factor to a small fraction is a reasonable baseline, and the hottest individual tables can go down to 0.01–0.05. Counterintuitive as it sounds, running vacuum more often means each run does less work. Frequent small cleanups beat rare, expensive catch-up jobs, every time.
autovacuum_analyze_threshold and autovacuum_analyze_scale_factor — same idea, but for triggering ANALYZE, which refreshes the planner's statistics. Default analyze scale factor is 0.1 (10%). Remember that planner distortion problem from earlier, where dead tuples make a table look bigger than it is? Stale statistics are exactly what causes that. On a high-write table, you want analyze running ahead of that curve, so dropping the global to a similarly small fraction is a solid move.
autovacuum_vacuum_insert_scale_factor (Postgres 13 and later) — this one's for insert-heavy or insert-only tables: event logs, audit trails, that kind of thing. Default is 0.2. Here's the twist: before Postgres 13, a table that only ever got inserts (no updates, no deletes) never triggered a normal autovacuum at all, because it never accumulated dead tuples. The only thing that would eventually touch it was the anti-wraparound vacuum, which meant a sudden, massive I/O event on a huge table with zero warning. Postgres 13 fixed this by letting inserts alone trigger a vacuum pass. Tuning this parameter down matters a lot if your workload is append-heavy.
autovacuum_max_workers — default is 3. This caps how many autovacuum processes can run at the same time across the whole database. On a system with a lot of active tables, all three workers can be tied up, and a table that suddenly needs urgent attention just queues up behind them. For high-write systems, 4 is a reasonable starting point. More workers alone won't save you, though, if they're all getting throttled by cost delay, which brings us to the next dial.
The parameters that control how fast autovacuum works once it starts
Once autovacuum decides to work on a table, it doesn't run flat out. It runs under a cost-based throttle, on purpose, so it doesn't hog all the I/O and choke your live queries. Every page it touches has a cost: hitting a page already in the buffer cache is cheap, reading from disk is more expensive, dirtying a page (writing to it) is the most expensive. Once the running total hits a limit, vacuum pauses for a set delay, then picks back up.
That's a good design. The problem is the default values behind it, which are tuned conservatively enough that on a genuinely high-write workload, vacuum spends more time paused than working. It simply can't outrun the rate dead tuples pile up.
autovacuum_vacuum_cost_delay — this is the pause length once the cost budget runs out. Setting it to 0 means autovacuum runs at full speed, same as a manual VACUUM. On SSD or NVMe storage, 2ms is a solid middle ground. If you're on spinning disk with other workloads competing for I/O, stay closer to 20ms so you're not starving real queries. Worth repeating: the fintech case from the opening was fixed by changing this one single value. The cost delay had throttled autovacuum down to almost nothing on a table that badly needed it running near full speed.
autovacuum_vacuum_cost_limit — this is the cost budget itself, the amount of work allowed before the pause kicks in. For high-write systems, 1000 is a reasonable target, and on fast storage, a range of 800–1000 generally won't cause measurable query slowdown. You can also set this per table:
ALTER TABLE t SET (autovacuum_vacuum_cost_limit = 1000);That's worth calling out on its own, because a per-table cost limit throttles workers on that table independently. A hot table getting aggressive vacuum treatment doesn't eat into the budget every other table is relying on.
The right combination genuinely depends on your storage:
- SSD/NVMe: cost_delay 0–2ms, cost_limit 800–1000
- Spinning disk, shared workload: cost_delay 20ms, cost_limit left alone or nudged up modestly
Two prerequisites need to be in place for any of this to work. track_counts needs to be on; otherwise autovacuum is flying blind on table statistics and simply won't trigger, no matter how well you've tuned everything else. And you need a properly sized shared_buffers. A well-sized buffer cache means more of vacuum's page reads land in memory instead of hitting disk, which lowers the actual cost per page and makes your cost-limit budget stretch further.
How to apply per-table overrides instead of moving all global defaults
Here's the thing about global settings: they're a floor, not a ceiling. They need to be safe enough for your smallest, quietest lookup table and your busiest, loudest write-heavy table at the same time. That's an impossible ask for one number. So don't ask one number to do it.
The fix is per-table overrides. Treat your hottest tables as their own vacuum domain, tuned independently of everything else:
ALTER TABLE orders SET (
  autovacuum_vacuum_scale_factor = 0.01,
  autovacuum_vacuum_cost_delay = 2,
  autovacuum_vacuum_cost_limit = 1000
);
No restart needed. These take effect on the next autovacuum cycle. You can check what's currently set on a table by looking at pg_class.reloptions.
How do you know which tables need this treatment? Same diagnostic as before: consistently high n_dead_tup, a last_autovacuum timestamp that's hours stale, or a table whose disk footprint is way out of proportion to how much live data it should actually hold.
A reasonable starting point for a high-churn table:
autovacuum_vacuum_scale_factor: 0.01–0.05 (down from the 0.2 global default)autovacuum_vacuum_cost_delay: 2ms on SSDautovacuum_vacuum_cost_limit: 1000, set independently so this table isn't fighting others for budget
Why not just lower the global scale factor to 0.01 and call it done? Because your small lookup tables don't need that. A scale factor of 0.01 on every table in the database means vacuum starts firing constantly on tables with a few thousand rows that barely ever change. That's wasted work for no benefit. Per-table overrides give you precision on the tables that actually need it, without dragging the rest of the database along for the ride.
One practical note: if the person tuning autovacuum isn't the same person running day-to-day queries against the database (common on bigger teams), having a shared view into live table statistics through a database GUI, rather than everyone writing their own ad-hoc queries against pg_stat_user_tables, makes it a lot faster to spot which tables are falling behind and confirm that a change actually worked.
Transaction ID wraparound: the failure mode that ignores your tuning
Everything above is about performance degrading gradually. Wraparound is different. Rather than slowing you down first as a warning, it just stops accepting writes.
Here's the mechanism. Every transaction that writes to the database consumes a slot from a 32-bit transaction ID (XID) counter. That counter isn't infinite. After roughly two billion transactions, old tuple visibility rules start to break down, unless those old tuples have already been frozen (marked with a special value, FrozenTransactionId, that sits outside the normal counter and never needs to be compared against it again).
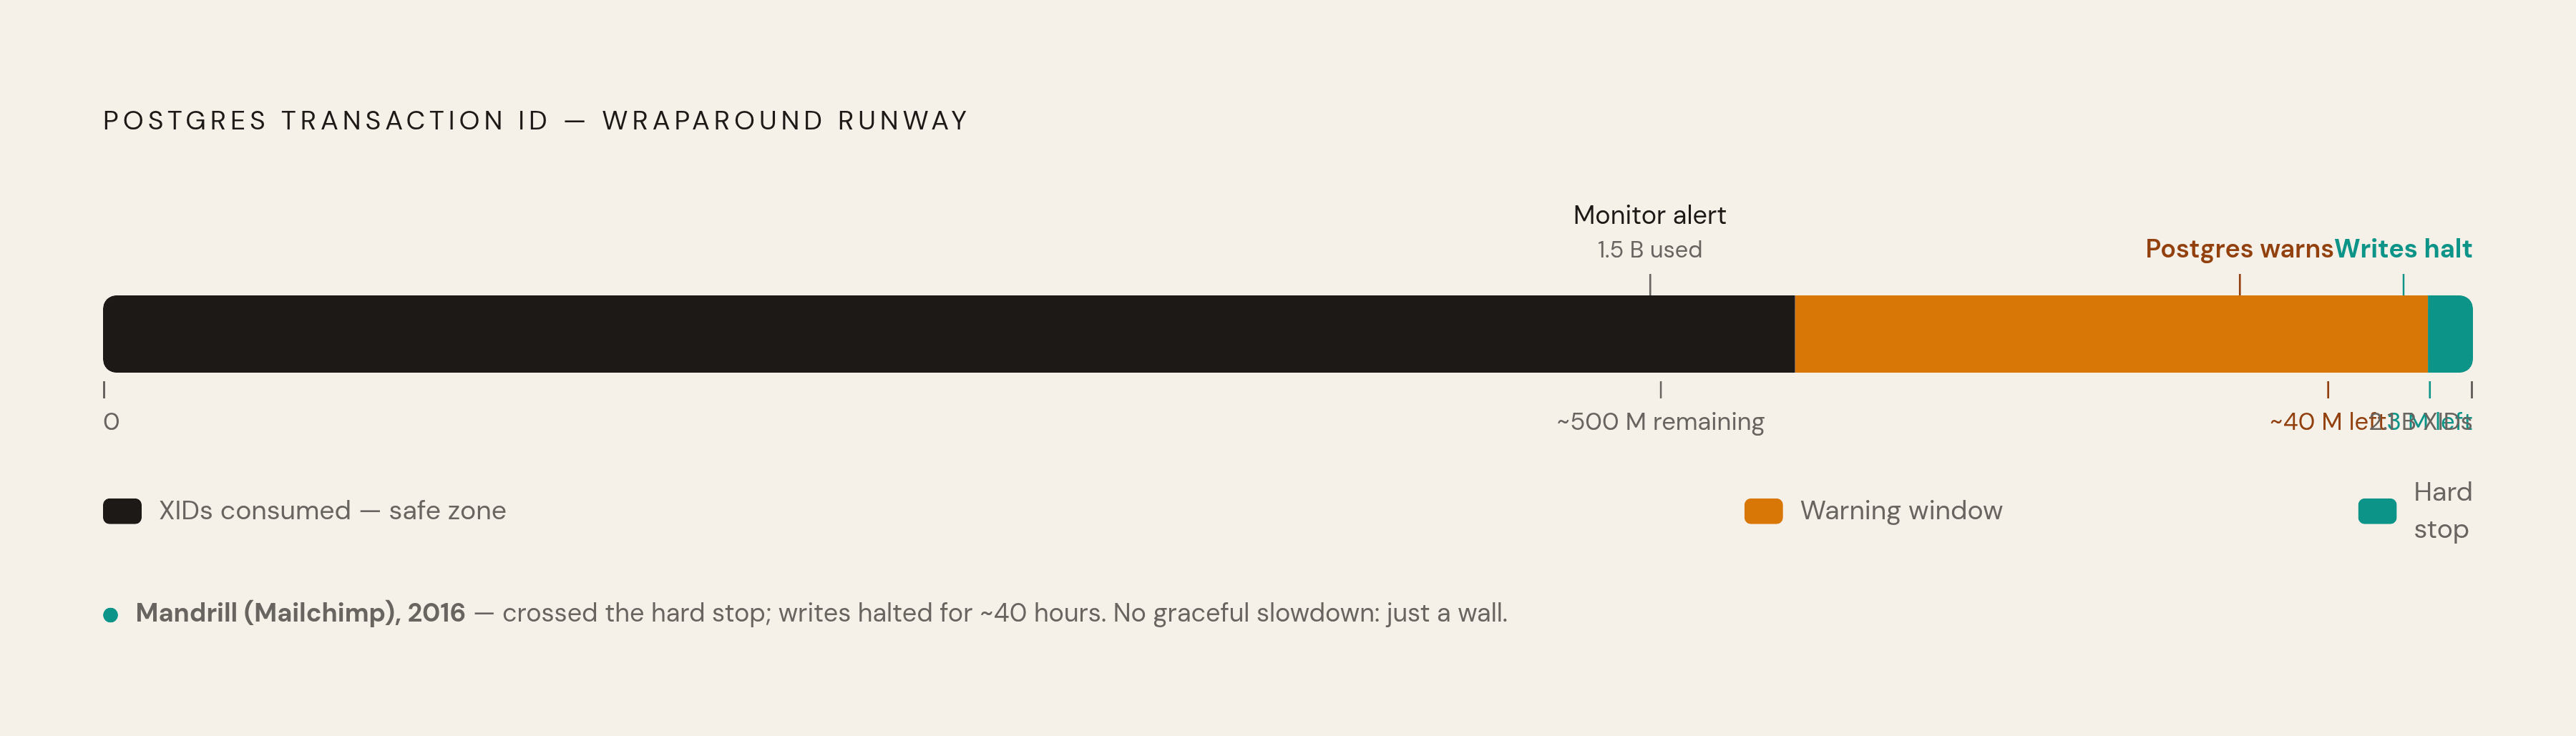
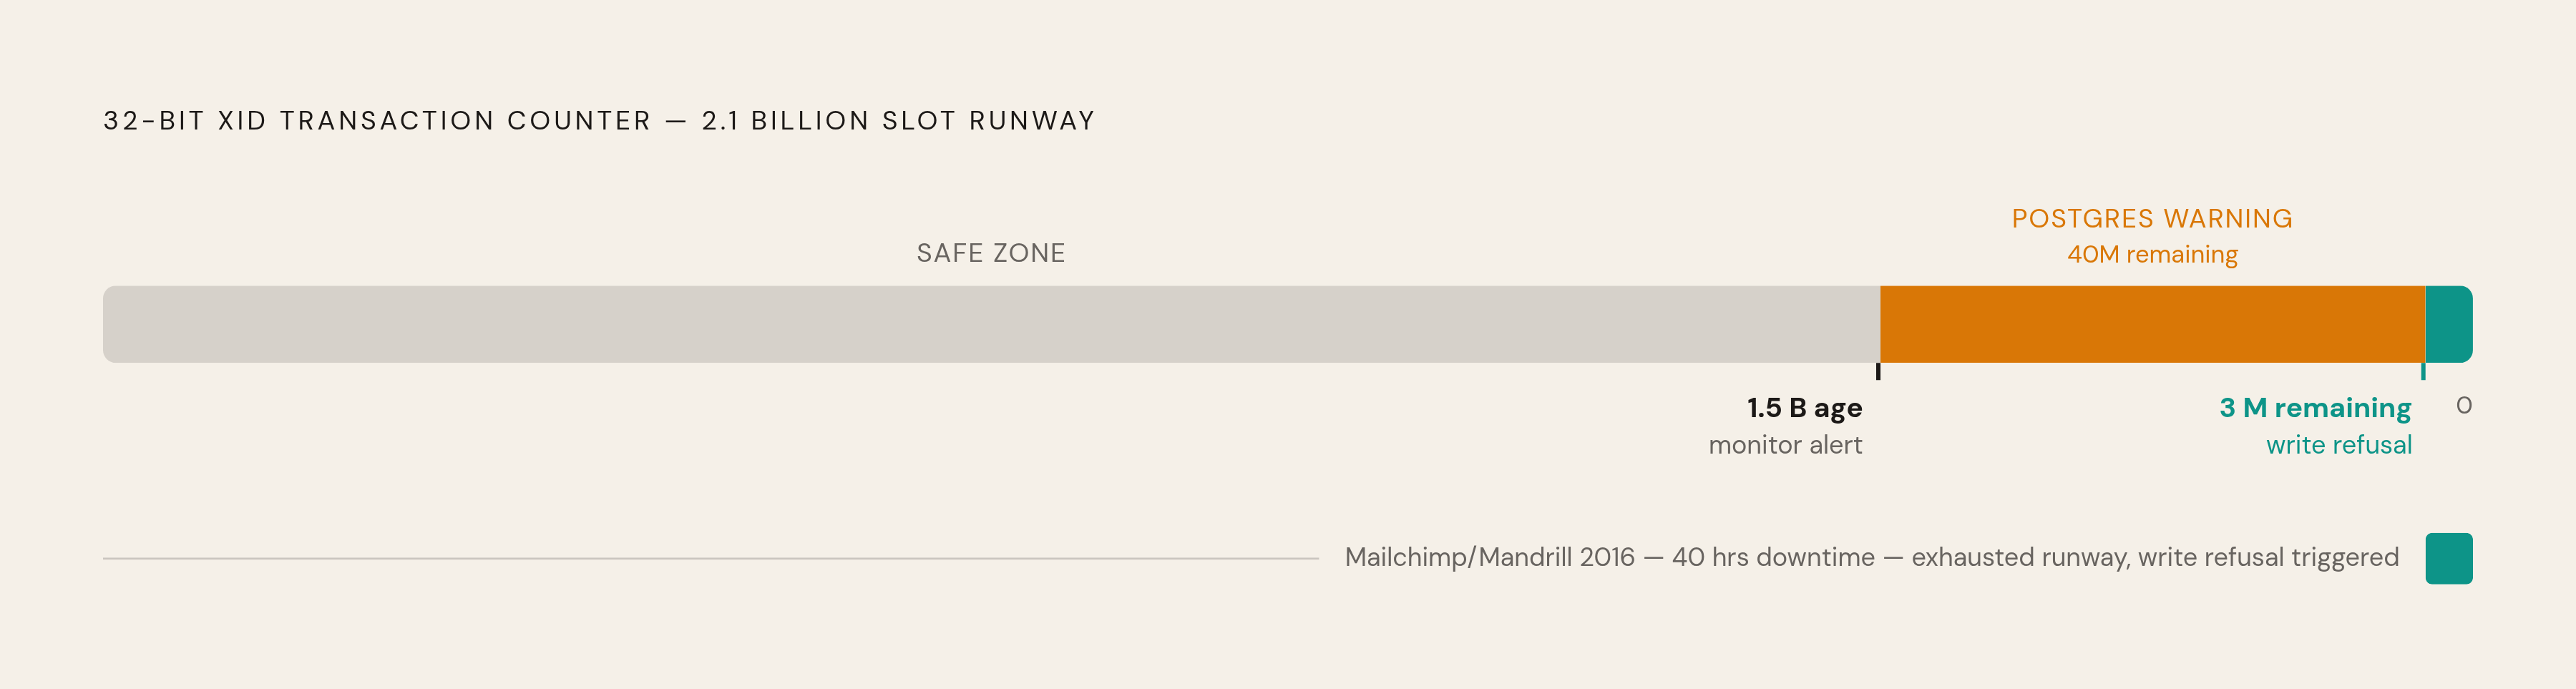
Postgres tries to warn you. It starts complaining once the counter has roughly forty million XIDs left. It stops issuing new transaction IDs entirely at around three million remaining, which is a smaller window than it sounds like on a busy database. There's no graceful slowdown once you've ignored the warning. It's a wall.
A sane monitoring setup should alert well before that: flag anything where a database's oldest unfrozen XID age crosses 1.5 billion. That still leaves real runway to fix the problem before it fixes itself for you, badly.
This isn't hypothetical. Mailchimp's Mandrill service went down in 2016 because autovacuum fell behind on a busy shard, wraparound protection kicked in, and writes halted outright. Recovery meant manual vacuums and table truncations, and the outage ran roughly 40 hours. It's the textbook public example, and it's worth remembering that this happened to people who presumably knew what autovacuum was.
Here's the part that should really change how you think about this: wraparound isn't just a high-traffic problem. It's a risk any database faces if freezing isn't keeping pace with the XID counter advancing.
Three parameters matter here:
autovacuum_freeze_max_age— the XID age at which autovacuum is forced to run on a table no matter what the dead-tuple thresholds say.vacuum_freeze_table_age— the XID age at which a normal vacuum run will also do an aggressive freeze pass.vacuum_freeze_min_age— the minimum XID age before a tuple is even eligible to be frozen, so very recent rows don't get frozen too eagerly.
And here's the twist that makes this section relevant to everything above it: an anti-wraparound vacuum doesn't play by the rules you just spent all this time tuning. You can spot one in pg_stat_activity by the phrase "to prevent wraparound" showing up in the query column. When that vacuum starts, it can't be canceled by conflicting operations the way a normal vacuum can, and it ignores cost-delay throttling completely. All that careful per-table tuning, the cost limits, the scale factors, none of it applies once you're in this state. The table just gets vacuumed, disruptively, right now, whether your live queries like it or not.
So the real lesson isn't "tune around wraparound." It's that hitting an anti-wraparound vacuum in the first place is a sign that routine maintenance already fell behind. It's not a mode your database is supposed to live in. It's a fire alarm.
Long-running transactions and replication slots: the blockers that defeat well-tuned autovacuum
Here's a scenario that trips people up constantly: every setting is tuned correctly, scale factors are low, cost delay is fast, workers are available, and dead tuples still aren't getting cleaned up. What gives?
Autovacuum can't reclaim a dead tuple if any live transaction anywhere in the cluster might still need to see it. That's not a bug, that's MVCC doing exactly what it's supposed to do. But it means a single open transaction, sitting there doing nothing, can pin the entire cluster's visibility horizon and block cleanup on tables it isn't even touching.
Where do these transactions come from?
- Someone runs
BEGINin a terminal session, gets distracted, and never commits or rolls back. That connection now sits in "idle in transaction" state, holding a snapshot indefinitely. - A long-running analytical query holds a read snapshot open the entire time it's running.
- A logical replication slot falls behind. The slot has to retain WAL and keep the oldest relevant XID alive until the subscriber on the other end catches up.
Of these, the forgotten BEGIN is by far the most common reason autovacuum looks broken when the configuration is actually fine. It's worth checking for before you touch a single parameter.
How do you find it?
SELECT pid, state, state_change, query
FROM pg_stat_activity
WHERE state = 'idle in transaction';
Look for anything sitting in that state for an unusually long time. That's your answer, more often than any scale factor or cost limit ever will be. All the tuning in this piece assumes autovacuum can actually get to your tables. A stray open transaction is the thing that quietly takes that assumption away.