MySQL Slow Query Log Configuration and Analysis
Tune this built-in log to catch the queries actually hurting performance.

MySQL ships with a built-in feature that catches slow queries before they turn into user complaints. It's called the slow query log, and it's off by default. Turn it on, tune it right, and it hands you a paper trail from "something feels slow" to "here's the exact query and here's the fix."
The log records any SQL statement that takes longer than a threshold you set, or that digs through more rows than a minimum you set. That's different from the general query log, which records every single statement that touches the server. The slow query log waits, quietly, and only speaks up when something's actually worth looking at.
Each entry includes a few key pieces: how long the query took to run (Query_time), how long it sat waiting for a lock (Lock_time), how many rows it handed back (Rows_sent), and how many rows it had to dig through to get there (Rows_examined). Add a timestamp and the query text itself, and you've got most of what you need to start digging.
Out of the box, MySQL only logs queries that take over 10 seconds. That default is close to useless — the queries actually degrading someone's experience live in the 200ms-to-2s range.
The log can write to a plain file (the default) or to a table called slow_log inside the mysql database, depending on how you set log_output.
Enabling the log and understanding each configuration variable
The variables that matter:
- slow_query_log = ON — the master switch
- slow_query_log_file — where the file lives, e.g. /var/log/mysql/slow-query.log
- long_query_time — the threshold, in seconds, that decides what counts as slow
- log_queries_not_using_indexes — logs any query that does a full table scan, regardless of how fast it finished
- log_throttle_queries_not_using_indexes — caps how many of those get logged, so one badly-written endpoint doesn't fill your disk overnight
- min_examined_row_limit — a floor on rows examined before a query even qualifies for logging
SET GLOBAL changes don't survive a restart unless you also write them into the config file, or commit them with SET PERSIST on MySQL 8. Put the setting in config management, so the threshold stays visible to whoever touches this server next.
Replicas are a separate case. Queries that come through replication don't get written to a replica's slow log by default. If replica performance matters, turn on log_slow_replica_statements to catch them.
The file itself grows, and left alone, it can get big enough to cause real disk pressure. Check its size on a schedule, and archive or rotate it before it becomes its own problem.
Tuning long_query_time to match what "slow" means for your application
That 10-second default isn't a recommendation. It's just the number MySQL ships with. What counts as "slow" depends on what the query is for.
A rough guide:
- A typical web app: start around 1 second
- An API or dashboard where users expect answers fast: 0.5 seconds, sometimes 0.2
- A reporting query joining several large tables: 3 to 5 seconds might be fine
- A login check taking 800 milliseconds: that's a problem, no matter what the general threshold says
Percona, which works with MySQL performance across large fleets of production servers, defaults to long_query_time = 2 in the field. That's a reasonable starting number if there's no SLA data to work from yet. Tighten it from there.
Setting the threshold to 0 logs every single query — useful for a short profiling session, not something to leave running in production. That's a different kind of logging with a different cost, covered next.
In dev and staging, go lower still. Something like 0.1 seconds catches an inefficient query while it's still cheap to fix.
Pair long_query_time with log_queries_not_using_indexes and it catches something the threshold alone misses: full table scans that happen to run fast today because the table's still small. Keep log_throttle_queries_not_using_indexes on too, or one chatty endpoint floods the log with the same warning over and over.
The performance cost of enabling the log
Logging some queries and logging every query are not the same cost.
Selective logging, meaning the slow query log running normally, barely touches performance. It only writes when a query crosses the threshold. Most production databases run it permanently without noticing it's there.
Logging everything is a different story. Percona's measurements, taken at around 20,000 to 25,000 queries per second, show the general log cutting performance by 6% to 20%, depending on how many connections are active. A separate analysis found roughly an 18% slowdown from the general log on workloads doing simple point-select queries, close to a worst case.
So the rule is simple: the slow query log, used selectively, is safe to leave running permanently. Full query logging is a tool reached for briefly, on purpose, and switched back off.
On a managed MySQL service (Azure, for instance), the cost of logging gets more noticeable as query volume climbs or as individual queries get bigger. Tune long_query_time with that in mind rather than copying a number from a blog post written for a different scale.
Reading a raw log entry before handing it to a tool
Before reaching for any tool, read one raw entry all the way through. Each one comes with a comment block, then the query itself.
Query_time is the total time the query took, start to finish. That's what tripped the threshold.
Lock_time is how long the query sat waiting for a lock before it even got to run. If Lock_time is high relative to Query_time, the problem isn't a slow query. It's contention, something else holding a lock this query needs.
Rows_examined vs. Rows_sent is the ratio that tells you the most. If a query digs through five million rows to hand back ten, it's doing work it shouldn't have to do. Missing index, first suspect. If a query examines roughly what it sends back but shows up in the log constantly, that's usually a missing cache, or the application calling the same query in a loop it doesn't need to be in.
Take a concrete case: SELECT * FROM orders WHERE YEAR(order_date) = 2025, run against a table holding millions of rows. That query examines all 5 million rows to return a fraction of them. Wrapping order_date in the YEAR() function stops MySQL from using any index on that column, even if one exists. The function has to run on every row before MySQL can compare it, so the index becomes useless. That one line is worth memorizing, because it's the most common way a perfectly good index gets defeated by the query sitting right next to it.
Reading entries one at a time works fine for spotting a pattern. It falls apart the moment there are thousands of them. That's what the next set of tools is for.
Summarizing the log with mysqldumpslow and pt-query-digest
mysqldumpslow comes with MySQL. Nothing to install. It groups similar queries together, stripping out specific values (the "2025" in the orders example, say) so you see the shape of the query, not one instance of it.
Useful flags:
- -s t sorts by total time
- -s c sorts by how often the query runs
- -s r sorts by rows returned
- -t N shows just the top N results
Sort by count and the real problem sometimes turns out to be the query running far more often than anyone realized, not the one everyone assumed was slow. The catch with mysqldumpslow: it ranks by a single execution's time. A query that takes 0.3 seconds but fires very frequently won't show up near the top, even though it's costing more total time than almost anything else on the server.
That's the gap pt-query-digest, part of Percona Toolkit, closes. It's a separate install, open-source, and it ranks queries by total time consumed across all executions: count multiplied by average time. It surfaces the query taking the most wall-clock time from your database, not just the single slowest run, and those are very often two different queries.
The output gives you execution time, query size, lock time, rows examined and sent, a checksum for each query pattern, and what percentage of total response time that pattern accounts for. It can read from the slow query log, the general log, the binary log, or straight from SHOW PROCESSLIST.
Running a database that serves several apps or tenants at once? Filter by schema:
--filter '$event->{db} eq "db_name"'A useful rule of thumb: the first three entries in a pt-query-digest report are where to start. They usually account for a share of total database time way out of proportion to their number.
Quick summary: mysqldumpslow for a fast first look with zero setup. pt-query-digest for a ranked, prioritized list, especially on a busy server where "slowest single query" and "query costing the most total time" are two very different answers.
Using EXPLAIN and EXPLAIN ANALYZE to confirm what the log suggests
The log tells you a query is slow. EXPLAIN tells you why MySQL chose to run it that way.
Take the query pattern the log or pt-query-digest flagged, and run EXPLAIN SELECT... against it, ideally on data that looks like production, not a mostly-empty test table.
What to look at in the output:
- type — how MySQL is retrieving rows. ALL means a full table scan; that's the red flag. ref, range, and eq_ref all mean an index is doing its job.
- key — which index, if any, got used. NULL means none did.
- rows — MySQL's estimate of how many rows it'll have to look at. The closer that number sits to the table's full row count, the worse the plan.
- Extra — flags like "Using filesort" or "Using temporary" point to extra work MySQL had to do beyond just fetching rows.
The combination to watch for: type = ALL, key = NULL, and rows close to the total size of the table. Together, those point straight at a query that isn't using an index at all.
Back to the orders example: EXPLAIN on that query shows exactly this pattern, because the YEAR() wrapper blocks the planner from using any index on order_date, confirming what Rows_examined already hinted at.
On MySQL 8 and later, EXPLAIN ANALYZE goes a step further: it actually runs the query and gives real timing next to the estimated plan. Run that against a non-production copy of a heavy table. Doing it on a live slow query means intentionally re-triggering the exact slowness you're trying to diagnose.
The three remediation paths and how to choose between them
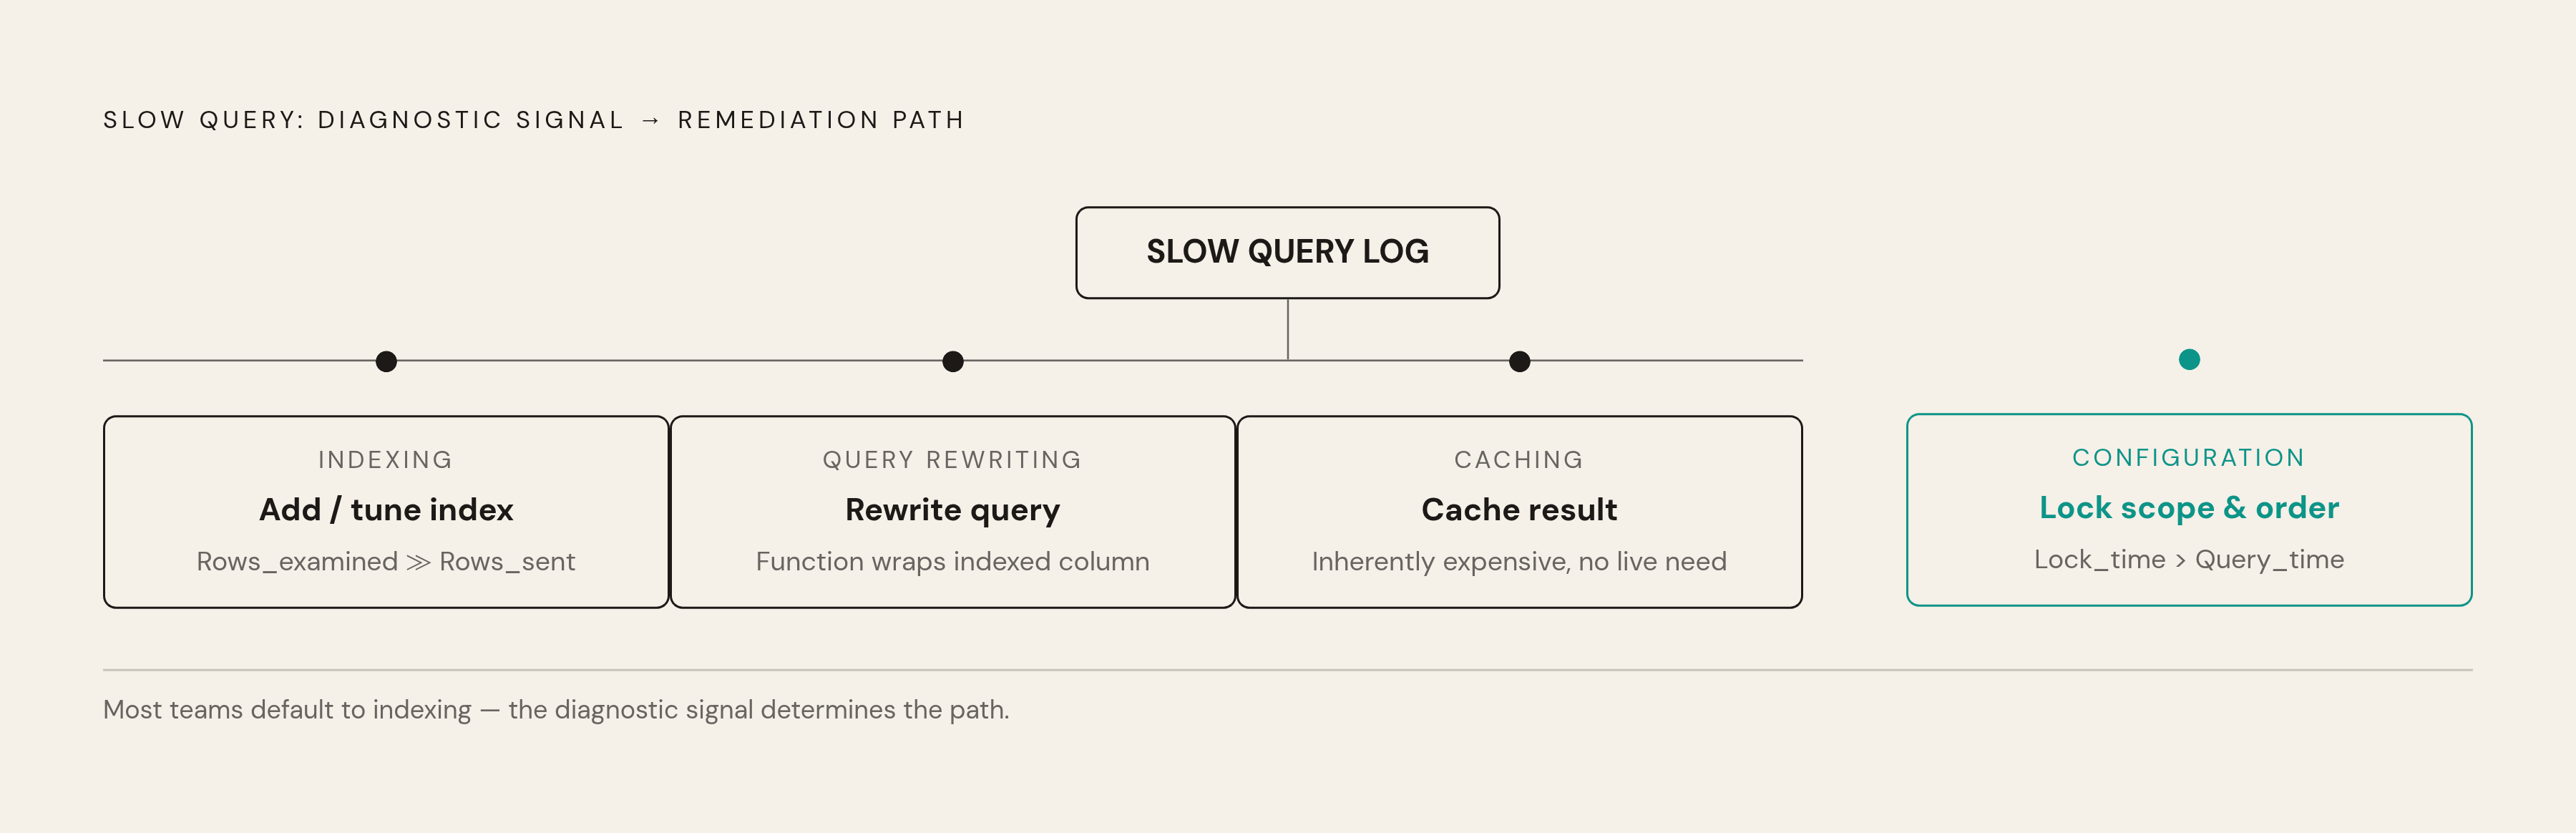
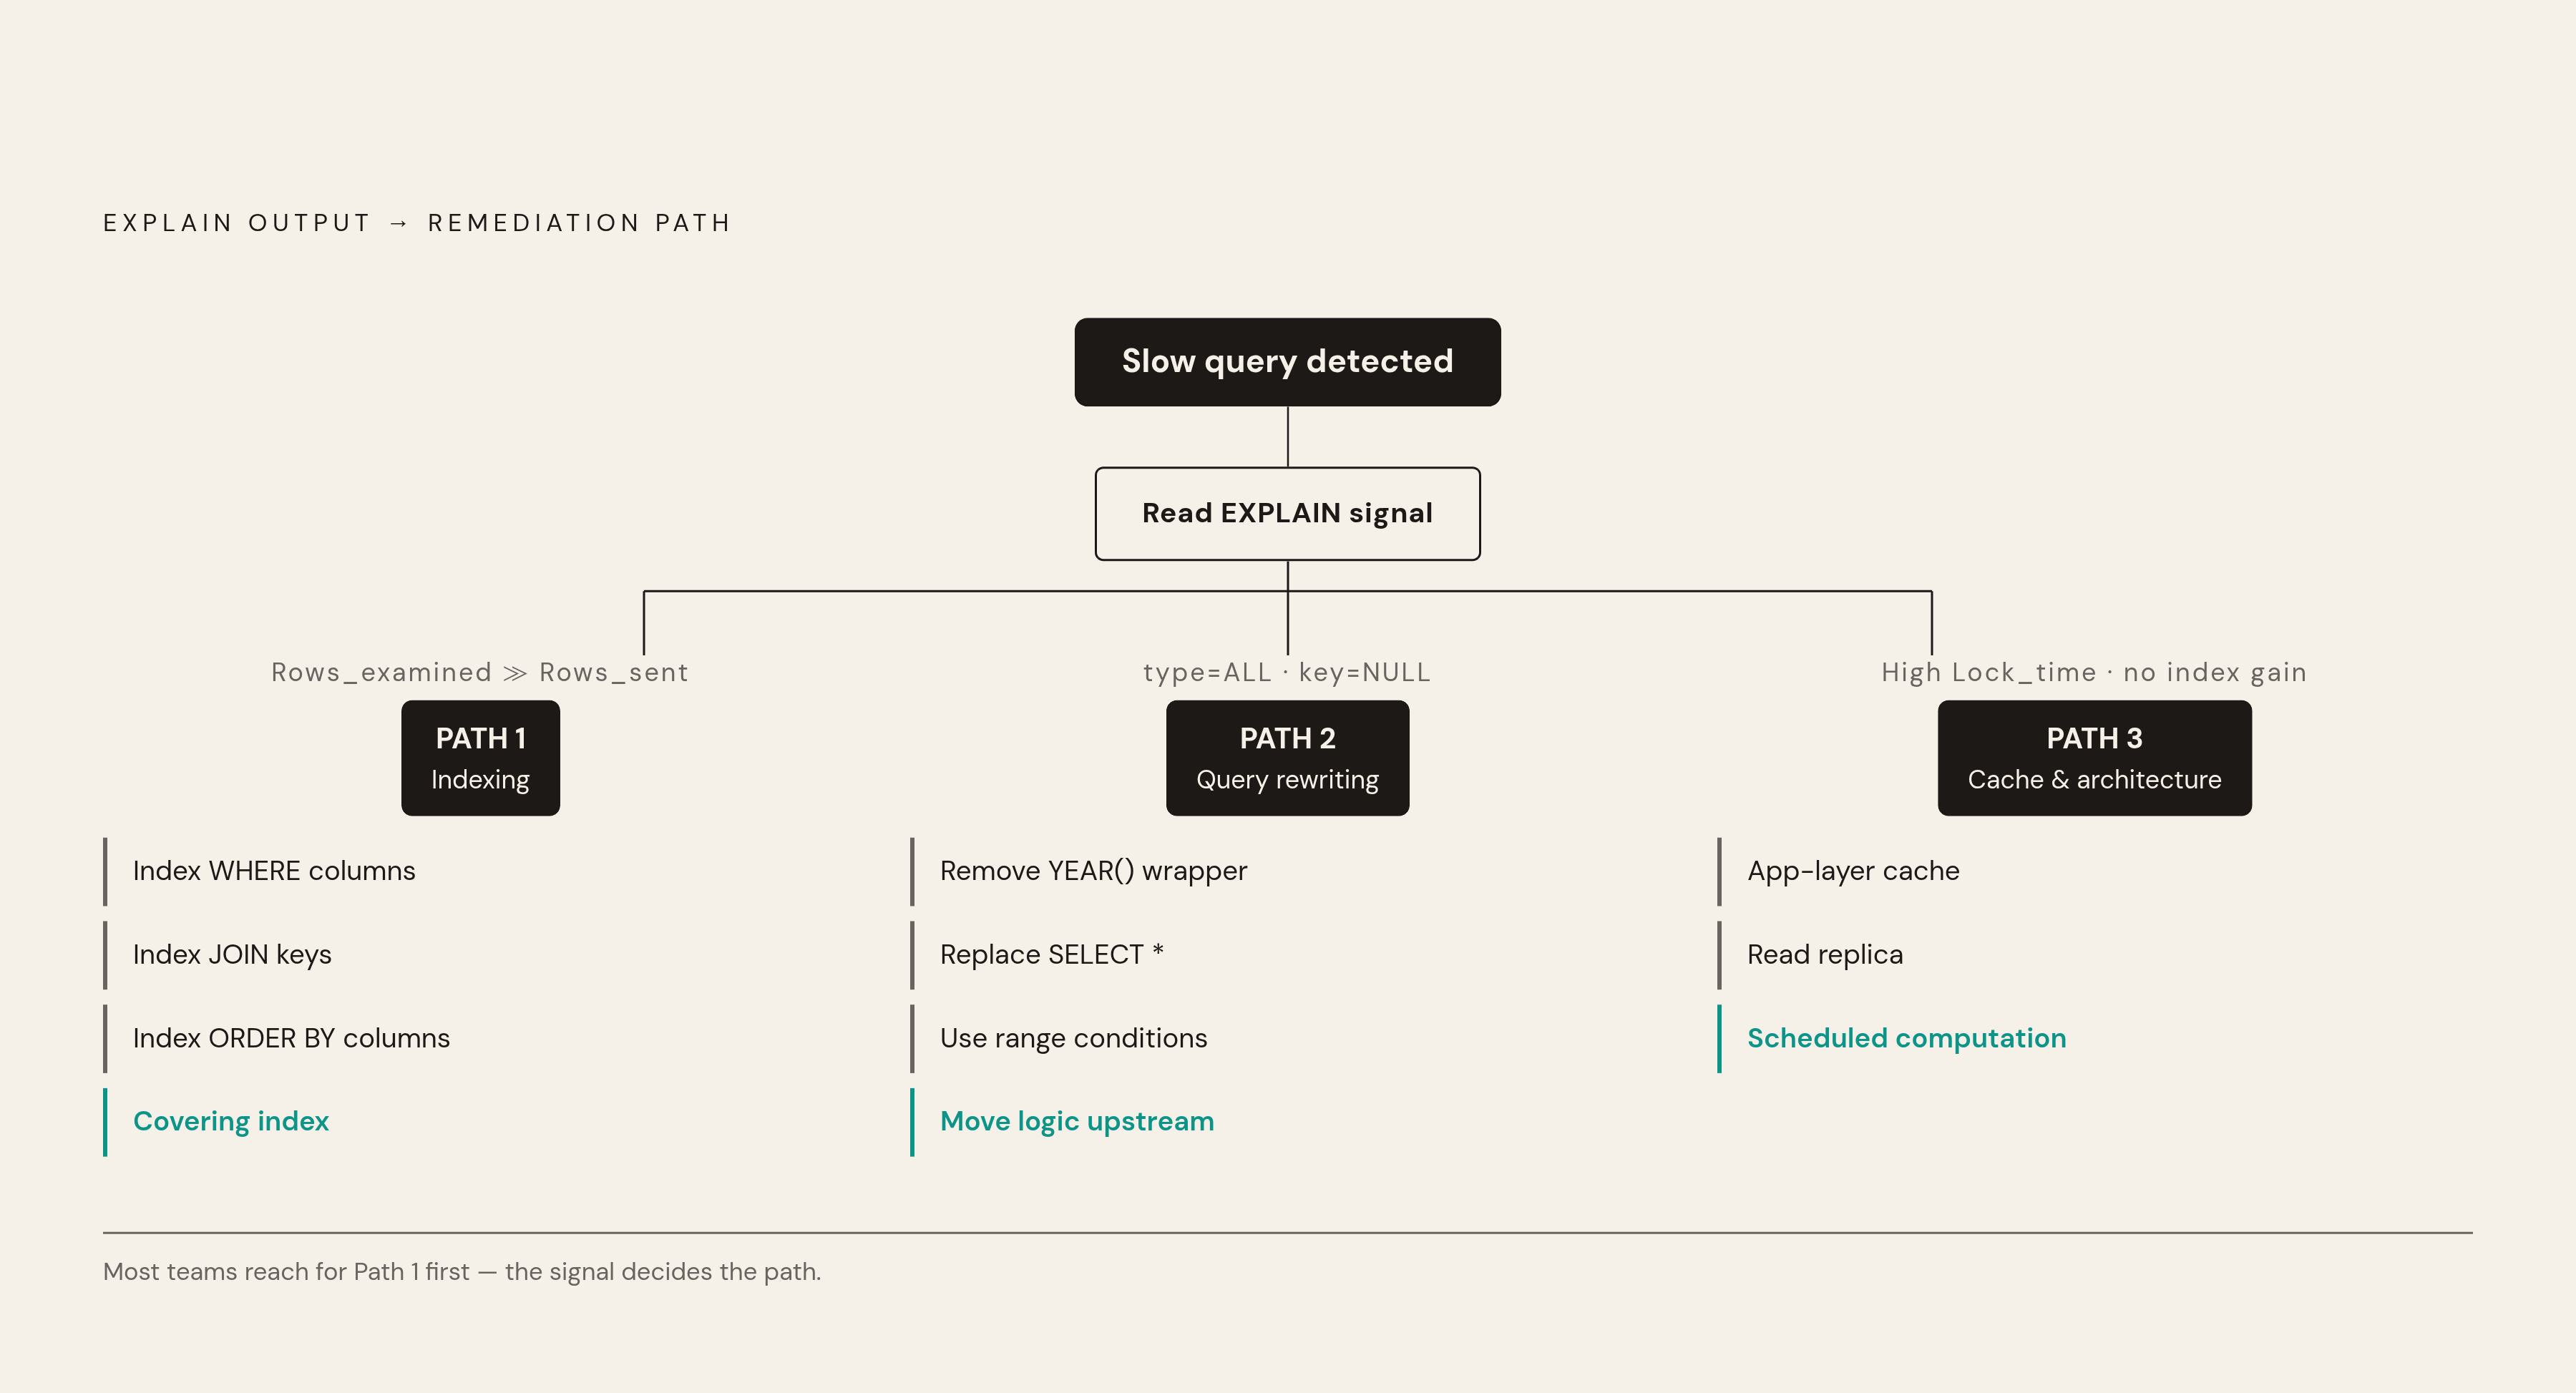
Almost every slow query falls into one of three buckets, and the EXPLAIN output usually tells you which one you're in. Most teams reach for the wrong one first: indexing gets thrown at problems caching should solve, and caching gets thrown at problems that are really bad query structure. Match the fix to the diagnosis, not to whichever fix is easiest to reach for.
Indexing. The right move when Rows_examined is way bigger than Rows_sent. Add indexes on the columns showing up in WHERE, JOIN, and ORDER BY clauses. A covering index, one that includes every column the query actually needs, lets MySQL answer from the index alone without touching the table row at all. Indexes aren't free, though: they slow down writes. Add them selectively, on columns with high read traffic and a lot of distinct values, rather than indexing everything in sight.
Query rewriting. For cases where the structure of the query itself blocks index use or does extra work. Strip function wrappers off indexed columns; the orders example becomes a range condition on order_date directly instead of wrapping it in YEAR(). Swap SELECT * for a named list of columns; less data moves, and it opens the door to covering-index plans. Break up queries trying to do too much in one shot, and push filtering earlier so less data moves through the rest of the query. If the same query fires over and over in one request cycle, move the logic upstream and cache the result instead of hitting the database dozens of times per page load.
Caching and architecture. For queries that are just inherently expensive, and don't need a live answer on every request. If the same result gets computed identically many times a minute, it belongs in an application cache, not recalculated against the database each time. Heavy reporting queries usually belong on a read replica, or as a result computed on a schedule, rather than running against the primary database the moment a user asks for it.
Configuration tuning. Less common, but real. If Lock_time is the standout number rather than Query_time, the fix isn't in the query text at all. Look at transaction scope, the order in which locks get acquired, or how granular your table and row locking is.
Whatever the fix, don't call it done on faith. Run pt-query-digest again against a fresh window of the log and confirm the query actually dropped off the top of the report. That's evidence the fix worked, not a guess that it probably did.
Making slow query monitoring a continuous practice rather than a one-time exercise
The slow query log doesn't pay off once. It pays off over time. A query that runs fine against a small table can quietly become the top entry in pt-query-digest six months later, once the table's grown and nobody rewrote the query to match.
Leave selective logging on, permanently, in production, at a threshold that matches your actual SLA. Percona's fleet default of 2 seconds is a fine place to start; tighten it as you learn more about what your users actually expect.
Run pt-query-digest on a regular schedule, weekly or right after deploys, instead of reaching for it only after someone complains. Keep an eye on the log file's size and rotate or archive it before it turns into its own disk problem. In dev and staging, keep the threshold low so regressions get caught before they ship, not after.
Teams that can look directly at their own database, rather than waiting on a monitoring alert to tell them something's wrong, catch problems earlier. That includes non-engineers who need to check a data question raised by a performance symptom, without filing a ticket and waiting on someone else to run the query for them.
Put together, the workflow looks like this: configure the log once, with intent. Analyze it regularly with pt-query-digest. Diagnose with EXPLAIN. Fix it in the right category, not the easiest one. Verify with a fresh log window. Repeat, because the data keeps growing whether or not anyone's watching.