Identifying and Killing Long-Running Queries in Postgres
Find hidden queries holding your database hostage before they freeze everything.

A long-running query in Postgres isn't just "slow." It's a session sitting there holding resources, blocking other sessions, and quietly freezing the database's ability to clean up after itself. This problem has a way of surfacing at inconvenient hours, often disguised as something unrelated. So let's walk through how to find these queries, read what Postgres is telling you about them, and shut them down without making the situation worse.
The word "long-running" makes these queries sound passive, like a car idling at a red light. They're not passive. They're doing damage the entire time they're open, and it comes in three flavors.
Resource consumption is the boring, obvious one. CPU, memory, I/O, all tied up for as long as the query runs. You can see it on a graph. Nothing mysterious here.
Lock contention is next, and this one moves fast. Anything that query touched, other sessions now have to wait behind. One slow UPDATE on a busy table can back up a queue of requests remarkably fast. It's like one person blocking a grocery aisle while everyone else piles up behind their cart.
MVCC horizon is the one that can really ruin your week, and often nobody thinks about it until it does. Postgres uses MVCC (multi-version concurrency control) so multiple transactions can see consistent snapshots of data at the same time. Great for concurrency. Terrible if you forget that Postgres can't clean up (vacuum) any row version still visible to an open transaction, anywhere in the database. A documented real-world case shows exactly how this plays out: an idle transaction left open for six hours turned a table into a mess — 50GB total, with 49GB of that being dead rows with nowhere to go, because every update and delete that happened elsewhere while that transaction sat open just piled up behind it. Autovacuum couldn't touch any of it.
Autovacuum kicks in, by default, after roughly 50 rows plus 20% of a table's rows have changed. A 1,000-row table triggers a vacuum after about 250 changes. Fine in theory. But that threshold assumes autovacuum can actually run. A long-open transaction doesn't slow it down. It stops it cold, for every table that transaction could see.
OLTP systems feel this first and feel it hardest. High-concurrency, latency-sensitive apps have almost no slack. One or two long-running queries, and your users are already tweeting about it.
Here's the part that trips people up, more often than you'd expect: a session doesn't need to be doing anything to cause all this. "Idle in transaction" means the connection is open, a transaction has started, and nobody's running a query right now. Looks harmless. Isn't. It still holds locks, still occupies a connection slot, still pins the MVCC horizon roughly where it was when the transaction started. Quiet does not mean safe. If anything, quiet is when this stuff can get away from you, because nothing on the surface looks wrong.
What pg_stat_activity shows and what its columns mean
pg_stat_activity is your dashboard for right now. One row per connected session. No history, no averages, no trend lines. If you close the tab, you lose the moment. Refresh it, that's the only way to watch things change.
A handful of columns do most of the work:
pid: the process ID. This is the handle you cancel or kill later.
state: what the backend is doing.
active: a query is running.idle: connected, doing nothing. Fine.idle in transaction: open transaction, no query running. This is the one that bites you.query_start: when the current query began. Subtract from
now()for elapsed time.query: the actual SQL, current or most recent.
wait_event_type / wait_event: is the session actively computing, or stuck waiting on a lock, disk I/O, or something else entirely? This single distinction changes what you do next.
usename, datname: who's running it, and where.
query_id (Postgres 13+): links back to
pg_stat_statementsand your logs if you want to dig further.
The state column decides which tool you're even allowed to use. Try canceling a session that's idle in transaction and nothing happens, because there's no query running to cancel. You're trying to stop a car that's already parked in the driveway.
And wait_event_type = 'Lock' tells you something else entirely: this query isn't slow. It's stuck. Someone else is holding it up. Kill it and you've done nothing but remove a symptom. The actual blocker is still sitting there, waiting for its next victim.
Two columns to file away for later: backend_xmin and backend_xid. They tell you how deep into the MVCC horizon a session actually reaches, which means they tell you who's holding old data hostage. We'll come back to them in a minute.
Finding queries that have been running too long
Start simple. This finds anything actively running past whatever threshold you pick:
SELECT pid, now() - pg_stat_activity.query_start AS duration, query, state
FROM pg_stat_activity
WHERE (now() - pg_stat_activity.query_start) > interval '5 minutes'
AND state = 'active';
Five minutes isn't a rule handed down from anywhere. A latency-sensitive OLTP app might want 30 seconds. A nightly reporting job might be totally fine running an hour. Set it to whatever your app actually tolerates, not what feels like a round number.
Once you've got rows back, four things matter:
Duration: how bad, really, are we talking?
Query text: is this a user request, a background job, or someone's forgotten migration script?
State: active versus idle in transaction points you toward different fixes.
wait_event_type:
Lockusually means this query is a victim, not the culprit.
That last point earns its own query, because dead tuples piling up under a seemingly healthy autovacuum usually means something is pinning the horizon in place:
SELECT pid, backend_xmin, backend_xid, ...
FROM pg_stat_activity
WHERE backend_xmin IS NOT NULL OR backend_xid IS NOT NULL
ORDER BY age(backend_xmin) DESC;
Whoever has the oldest backend_xmin or backend_xid is your real horizon-pinner. And that's not necessarily the session that's been open longest by the clock. It's the one holding the oldest snapshot, which is a subtle but important difference.
If you suspect a lock chain instead of one bad query, pg_blocking_pids(pid) is the tool. Join it against pg_stat_activity and you'll see the waiting session and what it's waiting on, side by side. pg_locks fills in the exact kind of lock in conflict, if you need that level of detail.
Duration, then state, then wait_event_type, then blocking chain. Work it in that order and you'll usually know pretty quickly whether you're looking at a slow query, a stuck query, or an innocent bystander that just happened to be in the wrong place.
Choosing between pg_cancel_backend and pg_terminate_backend
Two tools here. Not interchangeable. Pick the wrong one and either nothing happens or way too much happens.
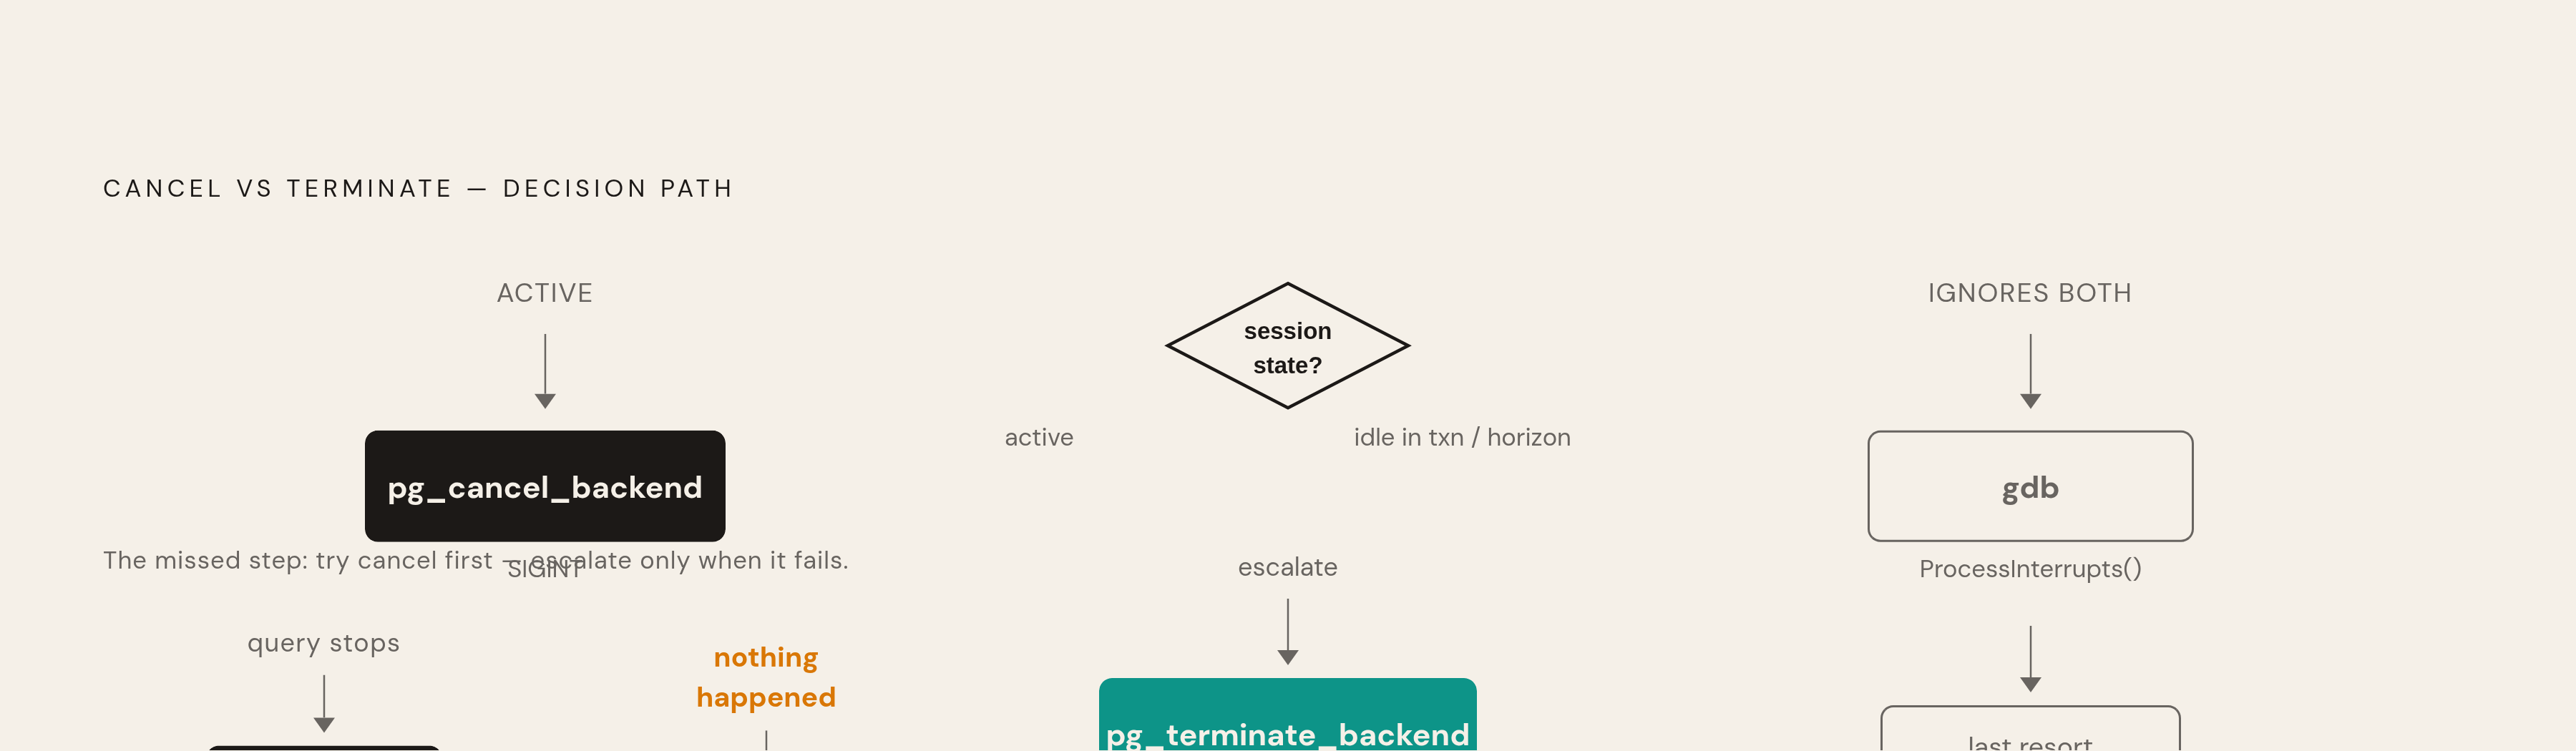
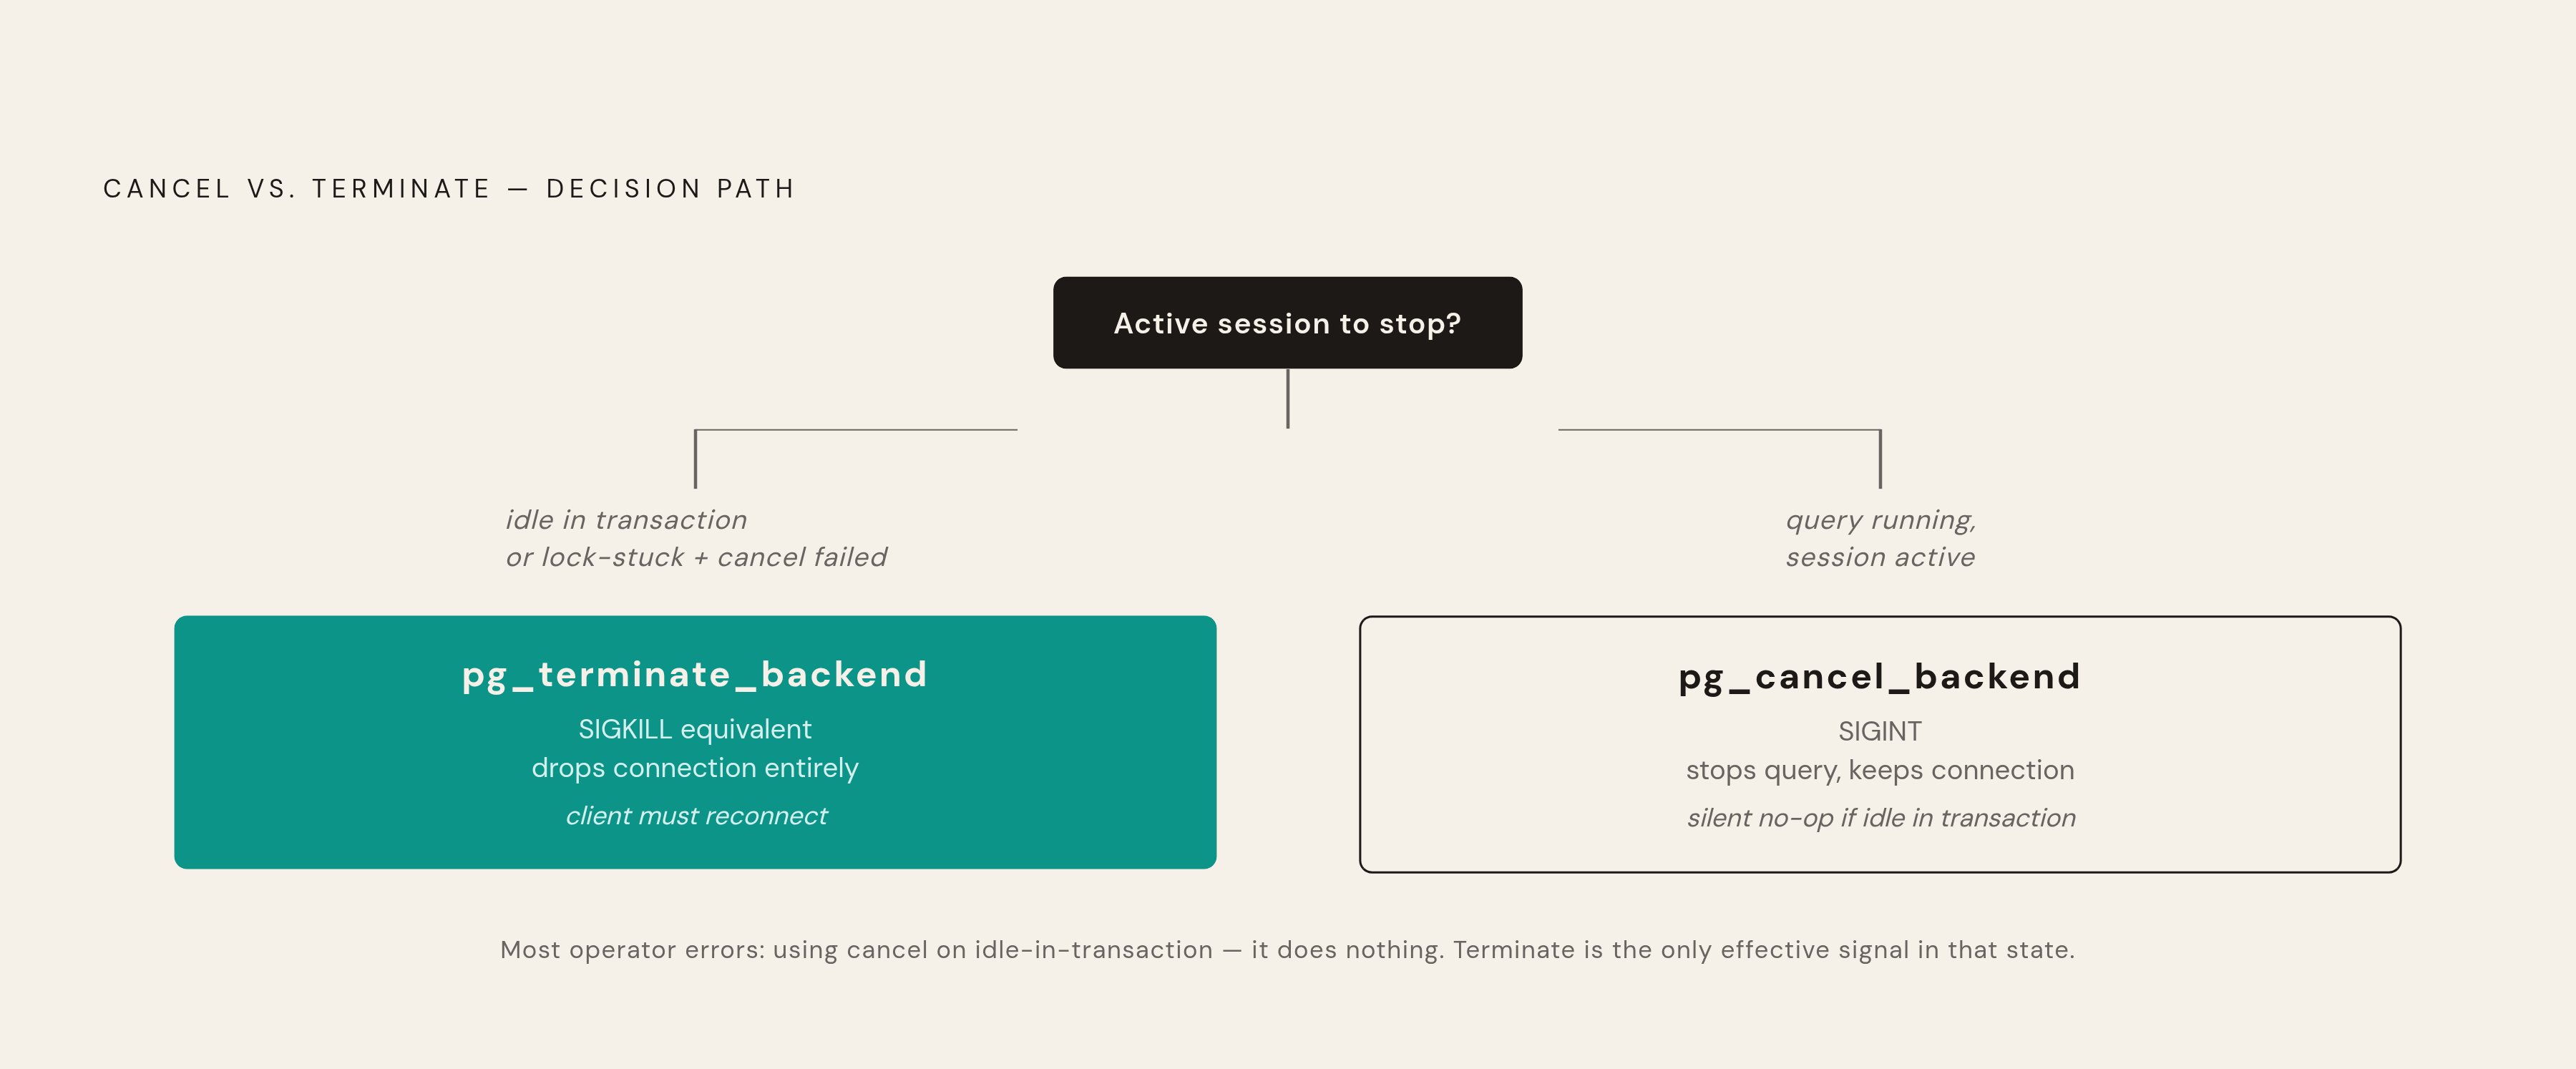
pg_cancel_backend(pid) sends a SIGINT. Stops the running query, sends the client an error, leaves the connection alone.
Client sees something like
ERROR: canceling statement due to user requestApps can often retry without reconnecting. Gentle, as these things go.
Catch: Postgres only checks for that signal at specific safe points during execution. If the query is stuck waiting on a lock, canceling it usually does nothing, because there's nothing interruptible happening yet.
pg_terminate_backend(pid) is kill -9 for a database connection.
Client sees
FATAL: terminating connection due to administrator commandConnection's gone. App has to reconnect from scratch.
Works regardless of lock state. It doesn't wait for a polite moment. There isn't one.
So which do you grab?
Cancel first, in most cases, for anything actively running. Less disruptive, and if it works, the session lives to run something else later.
Reach for terminate when:
The session is idle in transaction, so there's no active query for a cancel signal to interrupt.
You already tried canceling and waited a reasonable amount of time and nothing happened, especially with
wait_event_type = Lock.The session is pinning the MVCC horizon and isn't doing anything useful anyway.
For the "just clear everything" moment, this cancels every active query except your own session:
SELECT pg_cancel_backend(pid) FROM pg_stat_activity
WHERE state = 'active' AND pid <> pg_backend_pid();
That's a fire alarm, not a light switch. Use it when things are actually on fire, not as part of your Tuesday routine.
There's one more wrinkle: some queries are very hard to kill. A tight loop that never checks for interrupts, or a query stuck inside some third-party C extension, can ignore SIGINT and SIGTERM entirely. At that point, you're staring down a near-last resort: attaching a debugger like gdb and calling ProcessInterrupts() directly on the backend process. I'm mentioning this so you know it exists, not because I think you should do it. Please don't do this without someone who's done it before standing next to you.
Also, before any of this: check the PID twice. Check the query text. Misread one digit and you kill the wrong session. There's no undo button, and "sorry, wrong PID" is a rough thing to explain in a postmortem.
Preventing recurrence with Postgres timeout settings
Everything above is you, reacting, at some inconvenient hour. Postgres also lets you set this up so it rarely gets that far, through a handful of GUC (configuration) parameters. Most default to off. You have to go turn them on yourself.
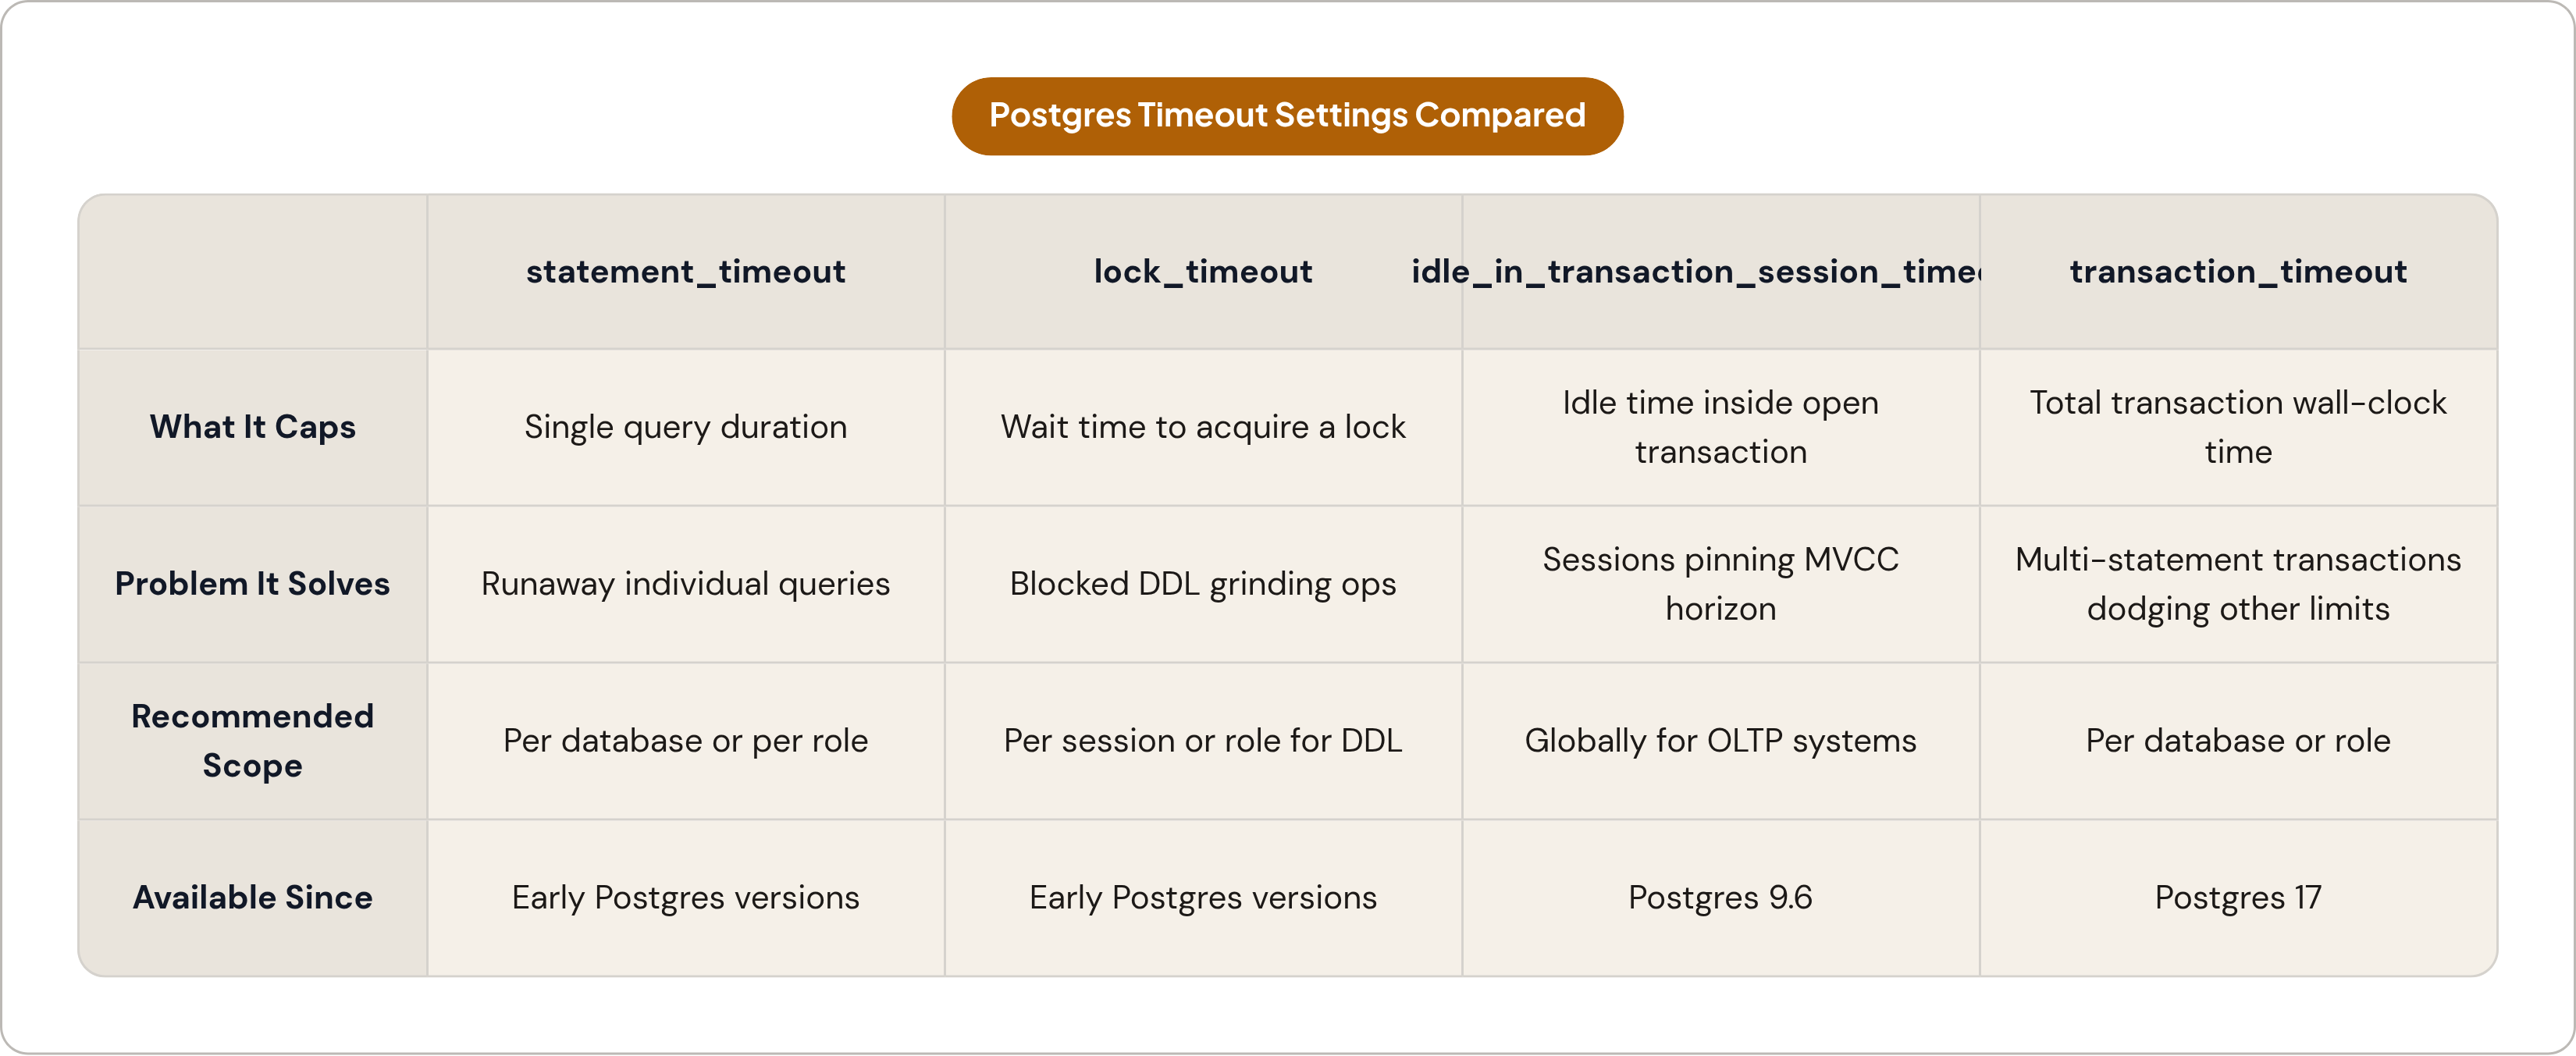
statement_timeout kills any single query that runs past a set duration. Postgres's own docs warn against setting this globally, because a global setting hits every session, including whatever migration you're running yourself at 2am. Scope it per database or per role instead:
ALTER DATABASE webapp SET statement_timeout = '10s';
ALTER ROLE report_user SET statement_timeout = '5min';
lock_timeout caps how long a transaction waits to acquire a lock before it gives up. Matters most for DDL, since something as simple as adding a column needs an ACCESS EXCLUSIVE lock that fights with almost everything else. One blocked DDL statement, no lock_timeout set, and you can watch the whole database quietly grind to a halt behind it.
idle_in_transaction_session_timeout goes straight after the villain from earlier: sessions sitting idle inside an open transaction. Set this, and Postgres kills those sessions itself once they cross the line, rolling back whatever transaction was open, releasing its locks, and freeing the vacuum horizon. Somewhere between 15 and 30 minutes is a reasonable starting point for most OLTP systems. Go tighter if connections are scarce and every one matters.
transaction_timeout, new as of Postgres 17, caps the total wall-clock time of a transaction no matter what's happening inside it. It closes a gap the other two leave wide open: a transaction made of small statements with tiny pauses between them can dodge both statement_timeout and idle_in_transaction_session_timeout while still eating the whole afternoon.
One gotcha here: stack more than one of these and the shortest timeout typically wins. Set transaction_timeout to 30 seconds and statement_timeout to 60, and you don't get a 60-second budget per statement inside a 30-second window. The transaction cap generally fires first. Keep coarser limits set higher than your finer ones, or don't set both.
None of these settings are exciting. Nobody brags about their lock_timeout at a dinner party. But that's the whole point: they turn "someone has to notice this query is misbehaving at 2am" into "the database just handles it." The system's health stops depending on whether an engineer happened to be staring at pg_stat_activity at the exact right moment.
And if staring at pg_stat_activity by hand, every time something feels off, sounds like a chore: it is. That's why tools that sit on top of your production database, like Basedash, exist to surface active sessions and long-running queries in a dashboard instead of a query you have to remember at 2am. The mechanics underneath don't change. Postgres still tracks the same state, still fires the same timeouts. What changes is how much of it you're forced to hold in your own head when something's already gone wrong.