MySQL InnoDB Buffer Pool Sizing in Production
The working set matters more than total database size when sizing your buffer pool.
MySQL performance problems, in practice, come down to a short list of usual suspects: a buffer pool that's the wrong size, missing indexes, and queries that ask the database to do more work than it should. Of those three, buffer pool sizing is the one worth checking first, because it's the fastest to fix and often the biggest lever you have.
Here's a real example to set the stakes: a SaaS client had P99 query latency at 4.2 seconds on a lookup that should have finished in single-digit milliseconds. The fix was a configuration change to memory allocation — no schema changes, no new hardware. The only thing that changed was how much of the working data actually stayed in RAM instead of getting pulled from disk over and over.
That's the thing about buffer pool misconfiguration: it doesn't creep up on you gradually. It sits there quietly until you hit a wall, and the wall shows up as an order-of-magnitude latency spike at the tail end of your distribution. Let's walk through how to actually size this thing, instead of guessing at a round percentage and hoping.
What "working set" means and how to measure it before touching any config
Before you touch a single config value, you need to answer one question: how much of your data does your application actually use, regularly?
That's your working set. It is not your total database size. A database can hold 100 GB and only ever touch 8 GB of it on a normal day. Old records, archived tables, cold partitions, none of that counts. What counts is the slice of data and indexes that gets hit again and again.
Start with a simple query to establish the ceiling:
SELECT ROUND(SUM(data_length + index_length) / 1024 / 1024 / 1024, 2) AS total_db_size_gb
FROM information_schema.tables;
This tells you the absolute upper bound. Your buffer pool never needs to be bigger than this number. But don't mistake the ceiling for the target. A heavily partitioned table with years of archival records might be responsible for 80% of your bytes and 2% of your actual reads. Total size tells you almost nothing about access patterns.
The real confirmation comes later, from a live metric called hit rate (more on that soon). But the mental model to set now is this: your goal is to fit the working set in memory, not the whole database. Sometimes those are the same thing. Usually, they're not. Know which one you're dealing with before you write a single line of config.
Why the 70–80% rule of thumb is a starting point for small servers and a trap for large ones
You've probably seen the advice: allocate 70-80% of RAM to the buffer pool on a dedicated MySQL server. It's in the MySQL 8.4 Reference Manual. It's in the AWS Database Blog. It's not wrong, exactly. It's just incomplete, and the bigger your server gets, the more incomplete it becomes.
Here's the logic behind the rule: dedicated server, 70-80% to the pool. Shared server, running other application processes alongside MySQL, dial it back to 50-60%. Either way, leave 1-2 GB for the OS and MySQL's own overhead. Fine, as a first guess.
But the rule assumes something that quietly stops being true as servers scale up: it assumes the "everything else" (OS, connections, buffers) grows in proportion to your RAM. It doesn't. A server needs roughly the same amount of OS overhead whether it has 16 GB or 1 TB of RAM.
Run the math on a 1 TB server. An 80% allocation reserves about 205 GB for "the rest of the system." Does your OS and connection pool actually need 205 GB? Almost certainly not. That's memory sitting idle instead of caching your working set, which is the opposite of what you want a buffer pool for.
Practitioner guidance sharpens this further: on servers with 1 GB of RAM or less, the 80% rule still holds cleanly. Past that threshold, the fixed-overhead assumption starts to break down, and the inefficiency compounds with every gigabyte you add.
So is the rule useless? No. It's a safe default when you have zero other signal to go on. But you're reading this because you want a better signal. Let's build one.
How to calculate a defensible buffer pool allocation for your specific server
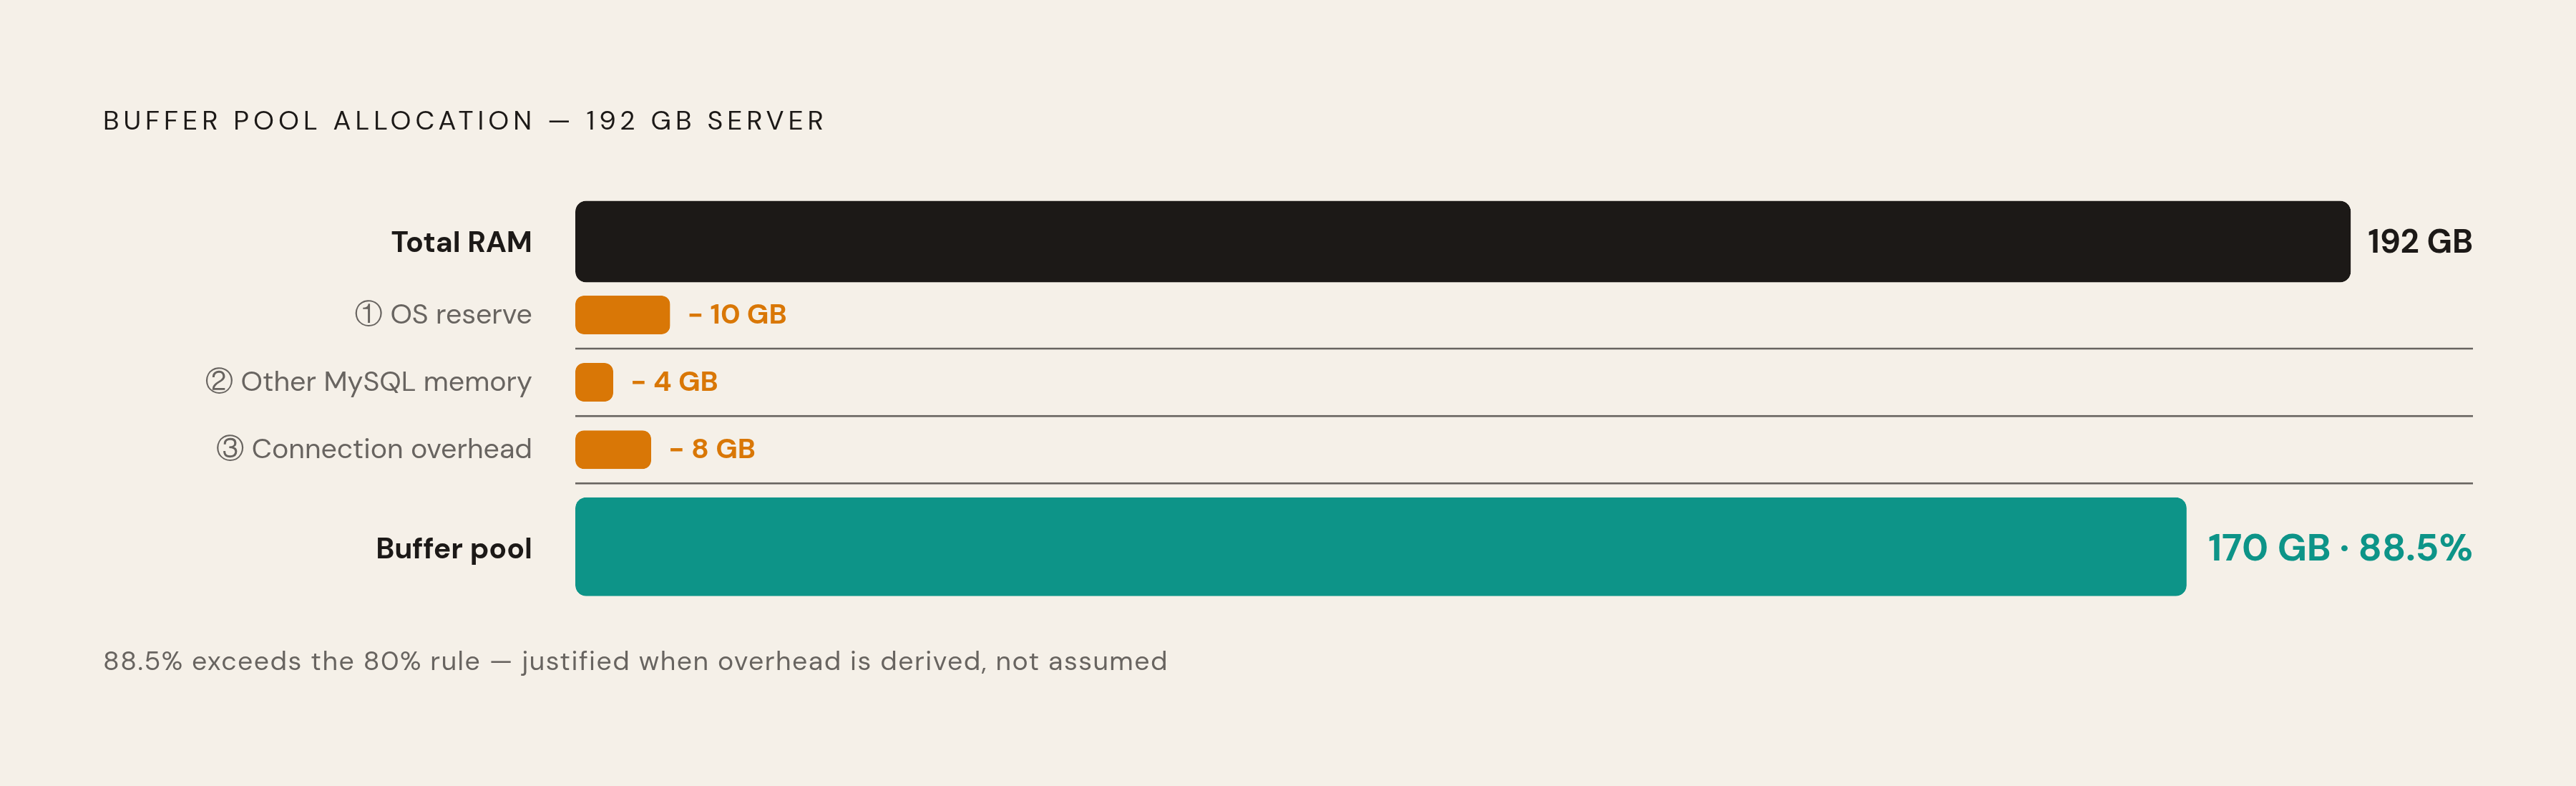
Instead of starting from a percentage, start from available RAM and subtract what you actually need elsewhere. What's left is your pool budget. Four steps.
Step 1: OS reservation. Reserve whichever is greater: 2 GB or 5% of total RAM. That's your floor for the operating system.
Step 2: Other MySQL memory. Budget around 4 GB for log buffers, binlog, sort and join buffers, thread stacks, and temporary tables. Treat this as a floor, not a ceiling. If you're running a high-connection instance, verify actual per-thread usage rather than assuming 4 GB covers it.
Step 3: Per-connection overhead. Each connection costs memory. Multiply your max_connections setting by the per-connection footprint (thread stack, sort buffer, join buffer) to get a worst-case number. On a busy server with a lot of concurrent connections, this adds up fast.
Steps 1 through 3 together give you the memory that can never go to the buffer pool, no matter how much you'd like it to.
Step 4: What's left is your pool candidate. Cross-check that number against the working set size you measured earlier. If your working set is 12 GB and you've got 40 GB of budget left over, you don't need to hand all 40 GB to the pool just because you can.
A worked example: on a 192 GB server, once OS and MySQL overhead are subtracted, roughly 170 GB remains available for the pool. That's about 88.5% of total RAM, higher than the 80% rule would suggest. That's fine. It's justified because the overhead was calculated explicitly, not assumed as a leftover percentage.
The hard floor, regardless of your math: size the pool as large as you can without ever triggering swap under real production load. Swap-induced latency and OOM kills are a much worse outcome than a buffer pool that's a few gigabytes smaller than ideal.
One caveat: this formula works cleanly on large servers and shows its limits on small-to-medium ones. Somewhere in the 2-32 GB range, neither the 80% shortcut nor the large-server math is precise enough. In that range, your working set size and your connection count matter more than any fixed ratio you could apply.
Per-connection memory as the hidden tax that shrinks the real pool budget
It's worth sitting with this one, because it's the step most sizing exercises skip, and it's the reason a config that looks fine at rest can fall over under real traffic.
Every connection to MySQL carries its own baggage: thread stack memory, a sort buffer, a join buffer. Individually, the defaults are small. But multiply that by hundreds of concurrent sessions and it stops being a rounding error. At high concurrency, total per-connection memory can add up to a significant figure at high concurrency, and every bit of that is memory the buffer pool doesn't get.
The calculation is simple:
SHOW VARIABLES LIKE 'max_connections';Take that number, multiply by the sum of your per-thread buffer sizes, and you've got your worst-case overhead figure. Use that number to adjust your pool budget before you ever set innodb_buffer_pool_size.
There's also a set of smaller memory structures worth keeping on your radar: the redo log buffer, the binlog buffer, temporary tables held in memory. None of these are individually large. But on a write-heavy workload, they add up, and they add up at the exact moments your server is under the most pressure.
This is really the difference between a sizing calculation that survives contact with real traffic and one that looks great in a spreadsheet and causes an OOM event the first time load spikes.
Buffer pool instances and when they reduce contention rather than add complexity
Here's a detail that's easy to miss: a single buffer pool is protected by a single mutex. Under high concurrency, every thread that wants to touch a page has to go through that one lock. Doesn't matter how much RAM you've thrown at the pool. If everything funnels through one mutex, you've built a bottleneck.
innodb_buffer_pool_instances splits the pool into independent regions, each with its own mutex and its own LRU list. That lets multiple cores access pages in parallel instead of waiting in line.
The rules, straight from the MySQL 8.4 Reference Manual:
- Range is 1 (the default) to 64 instances.
- It only kicks in when
innodb_buffer_pool_sizeis 1 GB or larger. - Each instance should be at least 1 GB for best efficiency. So the per-instance floor limits how many instances your pool size can actually justify. Do the math before you get ambitious with the setting.
- Common guidance: set instances equal to your CPU core count, capped by that 1 GB-per-instance floor.
When does this actually help? Workloads with a lot of concurrent threads and CPU-bound contention on the buffer pool mutex. When does it not help? Workloads that are mostly I/O-bound. Per Percona's community writing, the contention has to actually exist for splitting the pool into instances to matter. If your bottleneck is disk, not the mutex, more instances won't fix anything.
One planning note: total pool size has to equal a multiple of innodb_buffer_pool_chunk_size × innodb_buffer_pool_instances. And changing the instance count requires a full restart. So decide on instance count before you lock in your size, not after.
Worth flagging for anyone running MariaDB: this setting was deprecated in 10.5.1 and removed entirely in 10.6.0. Everything in this section is MySQL-specific.
Resizing the buffer pool online and the innodb_dedicated_server conflict to avoid
Good news first: innodb_buffer_pool_size can be changed live with a SET GLOBAL statement in MySQL 8.0 and later. No restart required.
But "no restart required" doesn't mean "instant and risk-free." The resize won't start until all active transactions finish, so plan the change during a quieter traffic window anyway. And the new value needs to be a valid multiple of innodb_buffer_pool_chunk_size × innodb_buffer_pool_instances. Get that math wrong and the value MySQL actually uses may differ from what you intended, so verify the effective setting after any resize.
Now, the trap that catches more teams than it should: innodb_dedicated_server.
When this flag is set to ON, MySQL ignores whatever you manually set for innodb_buffer_pool_size, innodb_redo_log_capacity, and innodb_flush_method. It auto-calculates all three based on detected server memory. So if you've set this flag on and then gone and manually tuned your pool size on top of it, your careful math is being quietly thrown away. Pick one approach. Never both.
This matters especially on AWS RDS. MySQL 8.4 on RDS enables innodb_dedicated_server by default, with its own auto-sizing table:
- Under 1 GB detected memory → 128 MB buffer pool
- 1-4 GB → 50% of detected memory
- Over 4 GB → 75% of detected memory
If you're on RDS, check whether auto-sizing is active before you assume your manual settings did anything at all.
One more thing worth remembering: changing innodb_buffer_pool_instances or innodb_buffer_pool_chunk_size still requires a full restart. The dynamic, no-restart resize only applies to the pool size itself.
The metrics that confirm whether the pool is correctly sized under real load
All the calculation in the world is still a guess until you check it against what's actually happening in production. Here's what to watch.
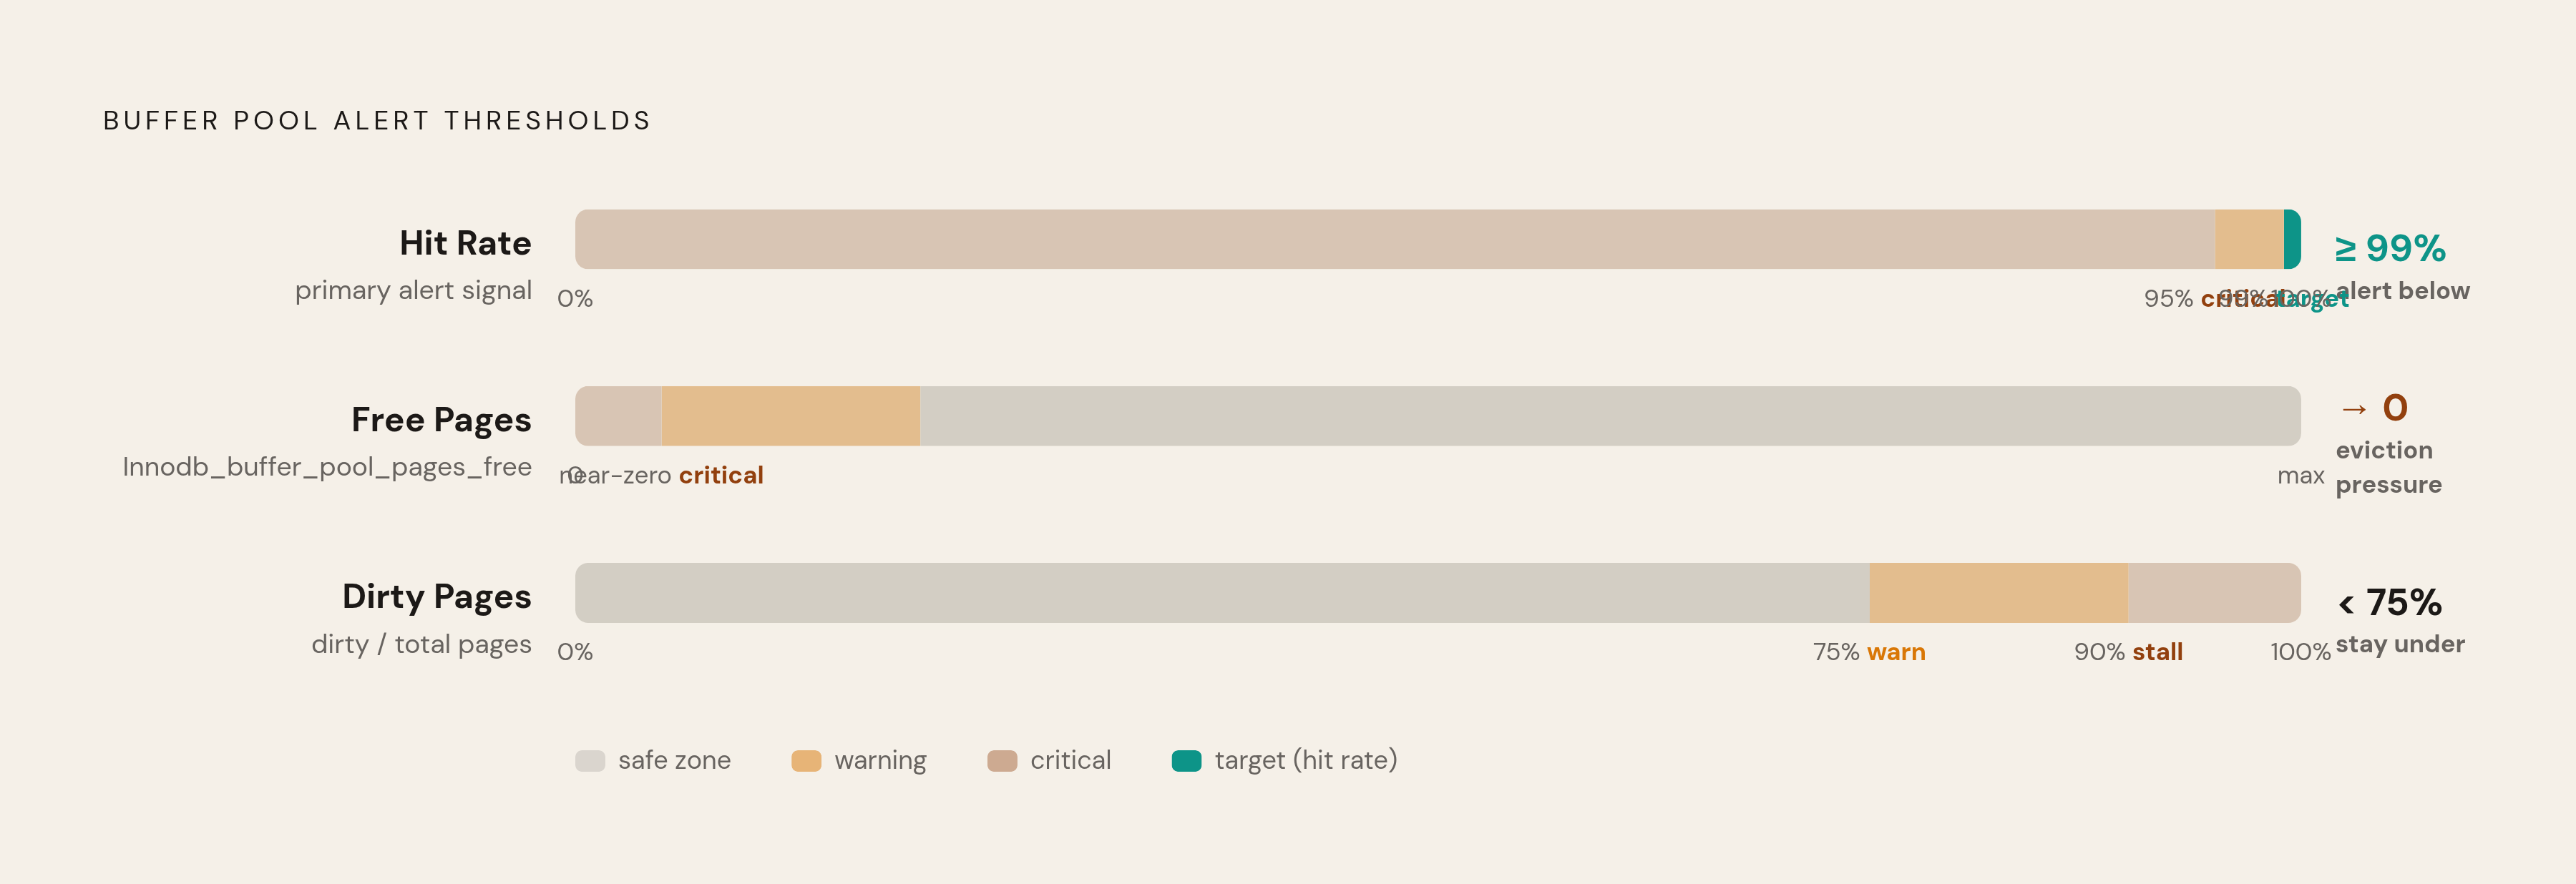
Buffer pool hit rate is the headline number: the percentage of read requests served straight from memory instead of disk. You want this above 99%. Below 95% is a strong signal your pool is too small for the working set it's trying to hold.
You can cross-check it with the miss rate formula:
(Innodb_buffer_pool_reads / Innodb_buffer_pool_read_requests) × 100Anything above 1% is a warning sign. Or query it directly:
SELECT HIT_RATE FROM information_schema.INNODB_BUFFER_POOL_STATS;But here's where it gets interesting, and where you have to think a little harder than "high number good, low number bad." A high hit rate on a tiny pool doesn't necessarily mean your sizing is great. It might just mean your working set is tiny too, and you got lucky. And a low hit rate on a large pool doesn't always mean "make it bigger." It might mean your workload runs large sequential scans that thrash the LRU list, cycling pages through memory faster than they can ever settle into "hot." Read the hit rate in the context of what your workload is actually doing, not in isolation.
Free page count (Innodb_buffer_pool_pages_free) tells you about pressure. If this number sits near zero consistently, the pool is under sustained strain. MySQL is spending its time evicting pages to make room instead of just serving them.
Dirty pages ratio (Innodb_buffer_pool_pages_dirty / Innodb_buffer_pool_pages_total) should stay under 75%. Cross that line and InnoDB is struggling to flush changes to disk fast enough. Hit the hard limit and writes stall outright. The fix here usually isn't a bigger pool, it's tuning innodb_io_capacity and innodb_io_capacity_max to match your actual storage IOPS.
Redo log waits (Innodb_log_waits) count transactions that got stuck waiting on the redo log buffer. Any growth here at all points to innodb_log_buffer_size or innodb_redo_log_capacity (available from MySQL 8.0.30 onward) being too small for your write rate. That's a separate tuning knob from buffer pool size, worth knowing so you don't chase the wrong fix.
For all of this, information_schema.INNODB_BUFFER_POOL_STATS is your source of truth. Read trends over time rather than relying on any single snapshot in isolation.
If you're setting up alerts, a sustained hit ratio dropping below 95% is your clearest early signal of buffer pool pressure. Any single metric alone can be noise, so watch for corroborating signals before acting.
For actually watching these numbers over time, options include MySQL Enterprise Monitor, Prometheus with the MySQL exporter, the OpenTelemetry Collector's MySQL receiver, Zabbix, or Nagios. Pick based on what you're already running elsewhere in your stack. There's no prize for adding a new monitoring tool just for this.
Restoring buffer pool state after a restart to avoid a cold-cache performance dip
Every restart wipes the buffer pool clean. That's the trade-off of an in-memory cache: it only knows what it's recently loaded, and a restart resets that to zero. Right after a restart, every single read has to go back to disk, even for data that was hot and fully cached moments before. That's the cold-cache dip, and on a server with a large working set, it can look a lot like a fresh performance incident even though nothing about your configuration actually changed.
The practical takeaway is simple: expect it, and don't panic when latency spikes right after a planned restart. It settles as the pool warms back up and repopulates with the pages your workload actually needs. Understanding this pattern, and distinguishing it from an actual misconfiguration, is part of the same discipline as sizing the pool correctly in the first place. A dip after a restart is expected. A dip that never recovers is your sign to go back through the working set, the metrics, and the math above.